Advertisement

We need your help now

Support from readers like you keeps The Journal open.

You are visiting us because we have something you value. Independent, unbiased news that tells the truth. Advertising revenue goes some way to support our mission, but this year it has not been enough.

If you've seen value in our reporting, please contribute what you can, so we can continue to produce accurate and meaningful journalism. For everyone who needs it.
Tsunami

In Pictures: Graphs and charts that show the tsunami's projected path

Weather centres around the Pacific rim show trajectory of deadly wave.

A COLLECTION OF images showing the tsunami’s estimated impact on Japan’s coast and its projected path across the Pacific Ocean to Hawaii and the west coast of the United States.

In Pictures: Graphs and charts that show the tsunami's projected path
1 / 5
  • Charts and graphs showing the tsunami's impact

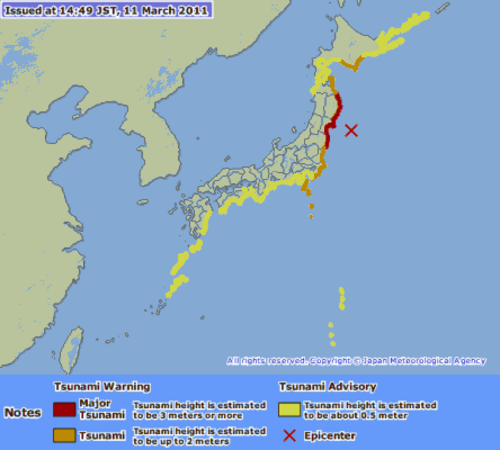
    The red x marks the epicentre of the earthquake, with red parts of the shore showing tsunami heights estimated to be 3 metres or higher. (Japan Meteorological Society)Source: Japan Meterological Society
  • Charts and graphs showing the tsunami's impact

    This image provided by the Pacific Tsunami Warning Center shows a "tsunami forecast model" created by the Pacific Tsunami Warning Center in Ewa Beach, Hawaii predicting the wave height of the tsunami generated by the Japan earthquake Friday March 11, 2011. The Hawaii's islands are located at the edge of the yellow pattern, but waves could be higher along the coastline when the tsunami arrives. (AP Photo/Nathan Becker - Pacific Tsunami Warning Center)
  • Charts and graphs showing the tsunami's impact

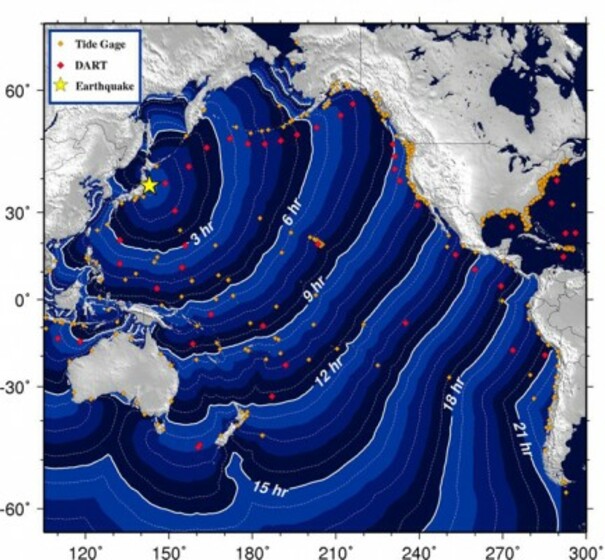
    This chart from the National Oceanic and Atmospheric Administration shows the estimated time the tsunami will take to reach different parts of the Pacific. (NOAA)Source: NOAA
  • Charts and graphs showing the tsunami's impact

    A computer screen at the Pacific Tsunami Warning Center shows the islands of Hawaii, Thursday, March 10, 2011 in Honolulu. Hawaii is under a tsunami warning. (AP Photo/ Marco Garcia)
  • Charts and graphs showing the tsunami's impact

    This tsunami forecast shows the projected path of the tsunami, with the severity decreasing from red, through orange and then yellow and green. (West Coast and Alaska Warning Centre)