Advertisement

We need your help now

Support from readers like you keeps The Journal open.

You are visiting us because we have something you value. Independent, unbiased news that tells the truth. Advertising revenue goes some way to support our mission, but this year it has not been enough.

If you've seen value in our reporting, please contribute what you can, so we can continue to produce accurate and meaningful journalism. For everyone who needs it.

Robert Shiller, one of the three Nobel Prize in Economics winners of 2013.
bubble prophet

Nobel Prize winner reponsible for two of most important economic charts in recent decades

Robert Shiller compiles two charts and makes them free for the public – and these charts predicted the dotcom bubble and the property bubble.

YALE UNIVERSITY PROFESSOR Robert Shiller was one of three people to win the 2013 Sveriges Riksbank Prize in Economic Sciences (also known as the Nobel Prize in Economics).

Shiller is already idolised among economists. He famously predicted two of the biggest bubbles of all time: the dot-com bubble and the housing bubble.  Both times, he published an edition of his book Irrational Exuberance, which described and predicted each respective bubble.

The theme of this year’s award was “Trendspotting in asset markets,” and the Nobel committee pointed to Shiller’s work in forecasting intermediate-term moves in asset prices.

“He found that stock prices fluctuate much more than corporate dividends, and that the ratio of prices to dividends tends to fall when it is high, and to increase when it is low,” said the Nobel Committee. “This pattern holds not only for stocks, but also for bonds and other assets.”

Shiller regularly updates his data and makes it available for free online.

He is responsible for two charts, that everyone in finance in the US – and beyond – follows very closely.

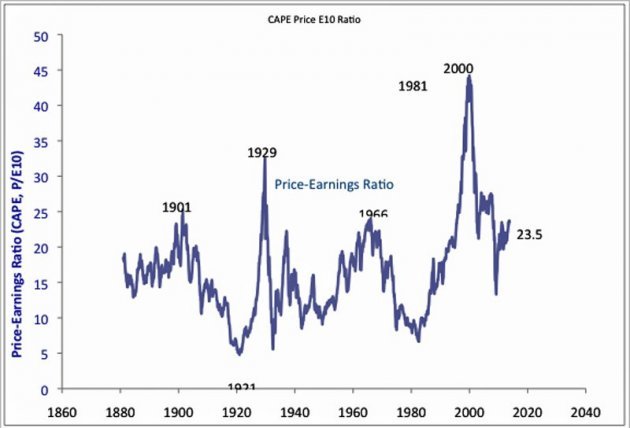
The first chart is of the cyclically-adjusted price-earnings (CAPE) ratio.  CAPE is calculated by taking the S&P 500 and dividing it by the average of ten years worth of earnings.  If the ratio is above the long-term average of around 16, the stock market is considered expensive. Shiller has argued that the CAPE is remarkably good at predicting returns over the period of several years.

As you can see, the CAPE ratio reached insanely high levels during the dotcom bubble.

image

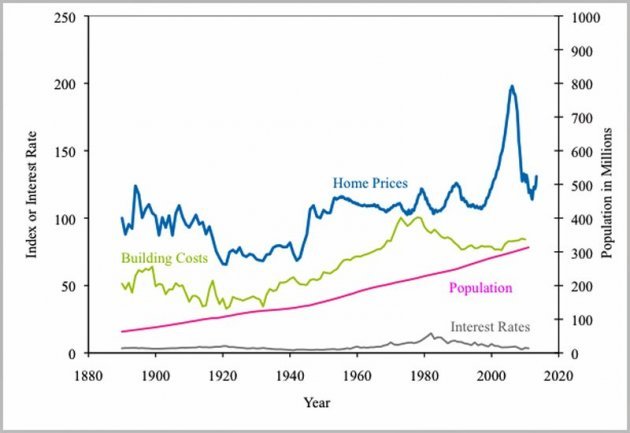
The second chart is of a long-term look at home prices adjusted for inflation.

During the early 2000s, home prices took off, forcing Shiller to publish the second edition of Irrational Exuberance.

As you can see, homes are not great assets if you’re looking for real returns.

“Housing traditionally is not viewed as a great investment,” he told Bloomberg’s Trish Regan earlier this year. “It takes maintenance, it depreciates, it goes out of style. All of those are problems. And there’s technical progress in housing. So, new ones are better.

“So, why was it considered an investment? That was a fad. That was an idea that took hold in the early 2000s. And I don’t expect it to come back. Not with the same force. So people might just decide, “Yeah, I’ll diversify my portfolio. I’ll live in a rental.” That is a very sensible thing for many people to do.”

image

No one will argue that Shiller wasn’t deserving of the Nobel prize. If anything, it was long overdue.

- Sam Ro

Assad: I should have won the Nobel Peace Prize>
OPCW wins Nobel Peace Prize for work in eliminating chemical weapons>
Malala Yousafzai on pacifism leaves Jon Stewart speechless>

Published with permission from
Business Insider
Your Voice
Readers Comments
22
    Submit a report
    Please help us understand how this comment violates our community guidelines.
    Thank you for the feedback
    Your feedback has been sent to our team for review.