Advertisement
FACTCHECK

FactCheck: Is minimum unit alcohol pricing "proven" to work?

Health Promotion Minister Marcella Corcoran Kennedy made a big claim about the effectiveness of the government’s alcohol policy, this week. We tested it.

banner

Updated: 24 August

THE GOVERNMENT PLANS to move forward with legislation that would impose minimum unit pricing on alcohol, this autumn.

In a debate on TV3′s Tonight With Vincent Browne on Monday, Junior Minister Marcella Corcoran Kennedy claimed that the policy has been “proven to work” in other jurisdictions, citing the example of British Columbia in Canada.

Is that true?

(Remember, if you hear a fact-fight over the airwaves, or read one in the news, email factcheck@thejournal.ie or tweet @TJ_FactCheck).

Claim: Minimum unit alcohol pricing has been proven to reduce health harms, elsewhere in the world
Verdict: Mostly FALSE

  • During the periods studied, in British Columbia, the number of deaths rose and fell, and hospitalisations rose every year
  • Researchers used complex statistical models to estimate correlations between minimum price levels and the number of alcohol-related deaths and hospital admissions
  • They found some statistically significant negative associations between price levels and deaths/hospitalisations, in certain categories and for certain time periods
  • However, the studies cited by the Minister do not reasonably allow for the conclusion that minimum unit pricing has been “proven to work”
  • Statistical models and certain principles of consumer behaviour would and do suggest that minimum pricing should lower death and disease rates, but the evidence available now does not conclusively prove that it has.

What was said:

TheJournal.ie / YouTube

You can watch a video of the relevant section from Monday’s debate, above and watch the full episode here. This is the most relevant part:

Minimum unit pricing has been proven to work, in British Columbia in Canada, for example. When they introduced it, they found, when they did the research that there were less deaths from…drinking, and there were less hospital admissions.

THE FACTS

Minimum unit pricing (MUP) legally prevents anyone selling alcohol below a set price (under the government’s plan, €0.10 per gram of alcohol). It is not a tax.

The public health rationale behind the policy is that:

  • “Hazardous” and problem drinkers, who are most at risk of alcohol-related death and illness, as well as young drinkers, are especially sensitive to the price of alcohol
  • They opt for cheaper brands of alcohol and higher-purity alcoholic drinks, and where the overall price of alcohol rises through tax increases, they seek out cheaper and “harder” drink
  • Unlike a tax increase, which retailers can decide not to pass on to consumers, MUP imposes a price “floor”, under which retailers are legally barred from going
  • Proponents of MUP argue that a per-gram of alcohol minimum price (rather than a minimum price for each category of alcohol) specifically targets the strongest and purest alcoholic drinks
  • This increase in the price of even the cheapest brands of alcohol therefore also specifically targets the most vulnerable drinkers, and forces them to reduce their alcohol consumption, they argue
  • This in turn, so the rationale goes, leads to a decrease in alcohol-related deaths and hospitalisations.

There is also an argument that the reduction in consumption purportedly brought about by MUP also leads to a decrease in alcohol-related crime (especially assaults) and sexually-transmitted diseases.

This FactCheck is sticking only to health issues, because that was the overwhelming focus of the Minister’s comments, and is the main rationale behind MUP.

We asked Marcella Corcoran Kennedy’s office and the Department of Health for evidence to support her claims.

In response, the department directed us to several different reports and academic studies on the issue.

Deaths

3/1/2011 Removal of restrictions on Alcohol RollingNews.ie RollingNews.ie

One of those studies, published in 2013, related to the Canadian province of British Columbia and tracked minimum alcohol prices as well as alcohol-related deaths between 2002 and 2009.

A few important points:

  • British Columbia already had MUP in 2002. The study did not relate to a period where MUP was introduced for the first time (which would be the case for Ireland), but rather tracked the correlation between changes in those prices and health harms
  • Their scheme involves a minimum price for a litre of each category of alcohol (i.e. $30.66 per litre of spirits, $2.22 per litre of draught beer). It is not calculated per gram of alcohol, as the Irish government’s policy is, which is important since the alcohol content of different beers, wines and spirits can vary significantly.
  • Most alcohol in British Columbia is distributed by the government. This is an important difference from the situation in Ireland, where private off-licenses and supermarkets, driven by profit motives, would have a huge incentive to maximise alcohol sales (unlike state-run stores in British Columbia), even under the constraints of MUP.

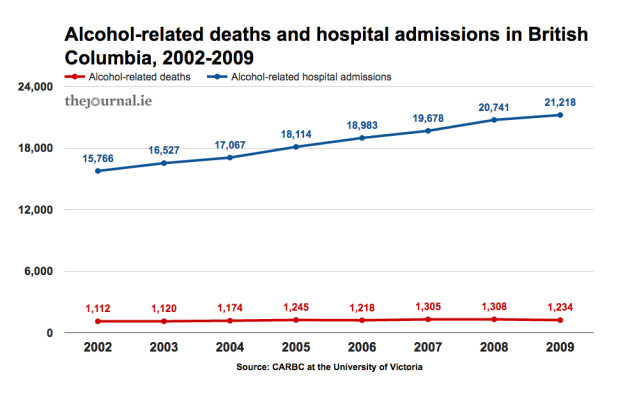
The first thing to note is that the number of alcohol-related deaths and hospital admissions generally went up in British Columbia during the period of 2002 to 2009.

BCdeaths

As you can see, there were only two occasions when the number of deaths was lower than the year before, and the number of hospital admissions rose every year.

This isn’t the key statistic, but it does show why it’s wrong to say, as Marcella Corcoran Kennedy did, that “there were less deaths from…drinking, and there were less hospital admissions”. There weren’t.

It is doubly wrong to say that this happened “when they introduced [MUP]“. As we’ve explained, this study relates to increases in already-existing minimum prices.

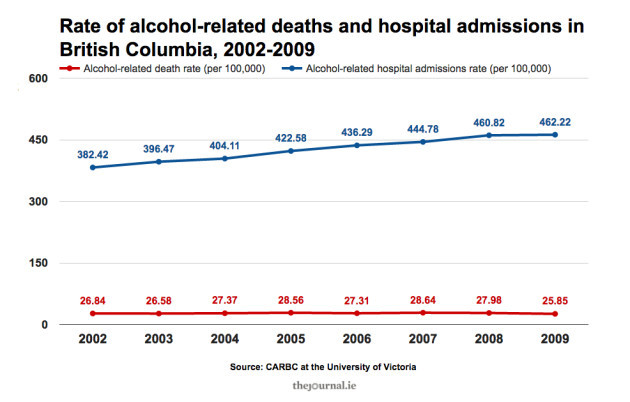
Let’s take into account changes in population, since (roughly speaking) more people means more drinkers, and more alcohol-related death and disease.

These are the death and hospitalisation rates (per 100,000 people):

BCdeathrate

The death rate was mixed during this period, rising and falling from year to year, while the rate of alcohol-related hospital admissions rose every single year.

By contrast, the study on alcohol-related deaths used complex statistical models to estimate the effects of price changes in geographical subdivisions of the province.

This also involved adjusting for factors like seasonality, aboriginal and minority population levels, population density, family income, and so on.

Here’s how the study describes how it measured deaths:

[Alcohol-attributable] deaths were estimated based on population attributable fractions (PAFs) for alcohol and the number of deaths for each of the disease or injury categories.
PAFs are the proportional reduction in population mortality that would occur if exposure to a risk factor such as alcohol use was eliminated or reduced.
They are calculated based on estimated population exposure to alcohol and established risk relations between consumption and different disease categories.

Only 14 out of the 64 correlations found by the researchers were statistically significant.

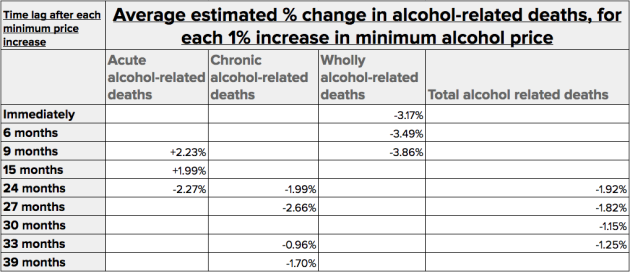
This chart shows what the estimated increase or decrease in alcohol-related deaths was, for every 1% increase or decrease in minimum prices, in several time periods following each price hike.

It is a measure of correlation, not a measure of actual price increases or decreases and actual deaths.

Screen Shot 2016-08-17 at 6.45.04 PM Dr Tim Stockwell Dr Tim Stockwell

It is also important to note that while the nominal minimum price of alcohol increased successively during the period in question, inflation meant that the effective minimum price (“real value”) did, at times, fall as well as rise.

Acute alcohol-related deaths are sudden deaths, such as from alcohol poisoning or falls. Chronic alcohol-related deaths are those resulting from longer-term illnesses like liver disease.

Wholly alcohol-related deaths are deaths where alcohol was the only causal factor.

What does it actually say?

Remember that the study uses complex statistical models to estimate an association between a 1% increase or decrease in minimum prices, and a percent change in the number of deaths.

It’s not saying that prices actually went up or down by 1%, and these were the actual, observed ensuing increases and decreases in deaths.

If that’s a bit confusing, welcome to the world of statistical models.

The study does not actually list what the “real value” of the minimum prices (adjusting for inflation) were throughout the period, but our rough analysis of figures in the paper indicate the average increase was around 5.7%.

You might assume, then, as the authors do, that if a 1% change in prices was negatively associated with a 3.172% change in wholly alcohol-related deaths, then a 10% rise in prices is associated with (or would lead to) a 31.72% fall in wholly alcohol-related deaths.

This is a claim made in the report, but it is off the mark.

Correlations don’t work like that - they are not necessarily linear.

If they were, then you could take the 3.17% fall in wholly alcohol-related deaths associated with a 1% price increase, and extrapolate that a 100% fall in wholly alcohol-related deaths would result from a 31.5% increase in alcohol prices.

This would require you to believe that an increase the equivalent of a pint of lager going from €4.70 to €6.18, or a 750 ml bottle of whiskey going from €27 to €34 would completely eradicate that category of deaths.

It’s not plausible because correlations aren’t necessarily linear.

Hospital admissions

A second study, also alluded to by the Department of Health, was published in 2013 by the same authors, and used the same time period and similar, complex statistical models.

Remember that, as we saw above, alcohol-related hospital admissions actually rose every single year between 2002-2009, even when adjusted for population changes.

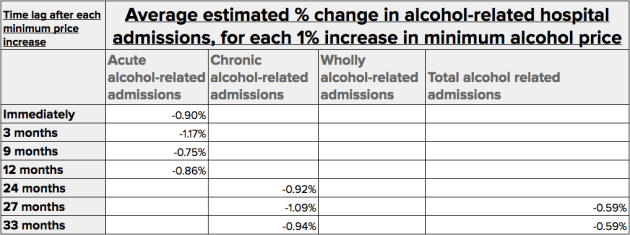
In any case, here are the study’s findings:

Screen Shot 2016-08-17 at 6.43.31 PM Dr Tim Stockwell Dr Tim Stockwell

As you can see, the results were even more minimal for hospitalisations than for deaths, with only nine statistically significant correlations out of 64.

Nonetheless, there were some estimated negative correlations for acute, chronic and total alcohol-related hospitalisations. There were no statistically significant correlations for wholly alcohol-related admissions.

Where’s the rest of the evidence?

GERMANY RUSSIA VODKA Associated Press Associated Press

Almost every province in Canada has some form of minimum alcohol pricing, but FactCheck could find only two academic studies specifically measuring the effects of MUP on alcohol-related health harms – the two outlined above.

The others addressed the effect of price increases on consumption of alcohol, and found, in short, a correlation between higher minimum prices, and lower drinking rates.

Once again, though, these were largely based on statistical models, and in many cases consumption rates went up.

According to a 2014 WHO report, five other countries have some form of minimum pricing: Russia, Belarus, Kyrgysztan, Moldova and Ukraine.

A 2015 study of alcohol-related deaths in Russia and Belarus did not isolate minimum pricing as a causal factor, but did look at larger “anti-alcohol” crusades within those countries, which have historically had particularly high rates of consumption, mortality and morbidity.

It concluded that those policies (which included some minimum price measures) made a modest contribution to declining adult male death rates, but that “the continuous reduction in adult mortality which has been observed…cannot be explained by the anti-alcohol policies implemented…”

We could find no research on minimum pricing and health harms relating to Kyrgysztan, Moldova or Ukraine.

Predictions

There have been many more studies by academics and governments which essentially use statistical models to predict the likely effects of pricing policies on consumption and health harms.

Many of them employ a model called the Sheffield Alcohol Policy Model (SAPM), developed at the University of Sheffield, and most of them predict significant reductions in drinking rates, deaths, hospitalisations and alcohol-related crime.

A 2014 SAPM for Ireland predicted the effects of a range of MUP rates on alcohol consumption and health harms.

Among those scenarios was a €1 per standard drink MUP combined with a ban on promotions. A standard drink in Ireland is 10 grams of alcohol, so €1 per standard drink is 10 cents per gram – the MUP proposed by the government. The government is also proposing a ban on promotions.

The model predicted that, after 20 years, this MUP policy would cause:

  • 210 fewer alcohol-related deaths per year (a 16.5% fall from the starting number), which includes -
  • 72 fewer acute deaths (9.7% fall)
  • 137 fewer chronic deaths (25.9% fall)
  • 6,294 fewer alcohol-related hospital admissions per year (10.7% fall), including -
  • 2,241 fewer acute admissions (9.2% fall)
  • 4,052 fewer chronic admissions (11.8% fall)

However, this is a set of predictions based on a statistical model, one which has been pointedly criticised in some quarters as relying on overly-simplistic assumptions about consumer behaviour in response to MUP, particularly the extent to which MUP would change the habits of heavy or dependent drinkers.

It is not proof that MUP has worked in reducing alcohol-related health harms, where it has been tried, although it obviously should be carefully and seriously considered.

Conclusion

3/1/2011 Removal of restrictions on Alcohol RollingNews.ie RollingNews.ie

For all that has been written about MUP, and all the academic research and policy papers produced on it, we are left with just a few studies that retrospectively analyse the effect of minimum pricing on alcohol-related health harms.

In the case of Russia and Belarus, one study found that death rates would have declined pretty much in the way they did, anyway, even if governments there hadn’t regulated the supply and pricing of alcohol.

In the case of Canada, specifically British Columbia, the studies found some negative correlations between minimum price changes and changes in the number of alcohol-related deaths and hospital admissions.

However, the reality remains that, even after adjusting for population growth, alcohol-related deaths rose and fell during that time, and alcohol-related hospital admissions rose every year from 2002-2009, a period of successive nominal minimum price increases.

And the different method of alcohol distribution in British Columbia, the fact they already had MUP, and their system of MUP, make it difficult to transfer the experience there to what the government is proposing in Ireland.

Besides those studies, there is little or no scientific evidence establishing an observed link between minimum unit pricing and declining health harms.

It might stand to reason that dearer drink leads to less drinking (and there is abundant evidence that minimum pricing does lower all-round consumption).

But the structure and pattern of that decrease (for example, how it effects the most at-risk drinkers) is less clear.

And the effects of minimum pricing on alcohol-related death and disease, although widely predicted and calculated to be significant, have not been conclusively proven.

These claimed effects may well be properly established in the future, as studies are replicated and improved and applied to more jurisdictions.

However, Minister of State Marcella Corcoran Kennedy claimed that MUP “has been proven to work”.

This is a very understandable conclusion to reach, but a close examination of what little evidence there is, does not support that assertion, as far as public health (the focus and context of her claim) is concerned.

The Minister also specified that MUP had been proven to work in British Columbia, because there were fewer alcohol-related deaths and hospitalisations (which is false) after it was introduced (which is a total misrepresentation of what happened, because British Columbia already had MUP).

We rate her claim Mostly FALSE.

Send your FactCheck requests to factcheck@thejournal.ie

Correction: This article previously inaccurately described parts of the two studies relating to British Columbia. In fact, the researchers estimated associations between changes in minimum prices (not increases, specifically, as we previously stated) and changes in alcohol-related deaths and hospitalisations. 

While it is true that there were successive increases in the nominal minimum prices of alcohol in British Columbia during the period studied, adjustments for inflation meant that the effective price (“real value”) of alcohol did at times decrease, and this is what the researchers actually measured.

This does not change our verdict – the available evidence remains insufficient to support the Minister’s claim that MUP has been “proven to work” – but we are happy to correct the article so that it more accurately describes the details of the studies in question.

The article has also been amended to give fairer prominence to the negative correlations found in the studies between minimum price changes and changes in alcohol-related health harms, and (in the Conclusion) to more clearly explain the rationale behind the verdict.

Your Voice
Readers Comments
70
    Submit a report
    Please help us understand how this comment violates our community guidelines.
    Thank you for the feedback
    Your feedback has been sent to our team for review.