Advertisement

We need your help now

Support from readers like you keeps The Journal open.

You are visiting us because we have something you value. Independent, unbiased news that tells the truth. Advertising revenue goes some way to support our mission, but this year it has not been enough.

If you've seen value in our reporting, please contribute what you can, so we can continue to produce accurate and meaningful journalism. For everyone who needs it.
Shutterstock
Love and Marriage

Brides and grooms are still getting older (but only in opposite sex marriages)

Same sex marriages still happen at a later age, but this is changing.

SAME-SEX COUPLES are getting married at a younger age each year on average but are still older when getting married compared to opposite sex couples.

CSO figures for 2018 show that the average age of a groom in an opposite-sex marriage is now 36.4 years compared to 36.1 years in 2017. That translates to grooms being an average of about four months older than last year. 

Brides in an opposite-sex couple now marry at an average age of 34.4 years compared to 34.1 years last year. This also about four months older than last year. 

In same-sex marriages, partners are generally older when they marry but this is getting younger on average. Men in same-sex marriages are 40.1 years on average while women are 38.7.

Last year the average was 40.3 years for men and 40.5 years for women.

This means that women in same-sex marriages were almost two years younger on average in 2018 compared to 2017.

PastedImage-54825 CSO.ie CSO.ie

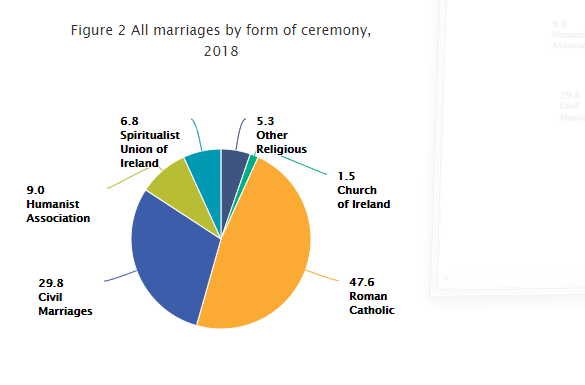
The CSO figures also looked at marriage ceremonies and the decline in religious ceremonies, where Catholic ceremonies have slipped below 50% for the first time.

Stats for 2018 showed that 49.2% of weddings were Catholic marriage ceremonies, down from 50.9% in 2017, 53.7% in 2016 and 56.7% in 2015. 

Over 96.2% of couples married in 1980 were in Catholic ceremonies. 

Despite the decline, Catholic ceremonies remain by far the most popular marriage ceremonies in the State, with civil marriages the next most popular at 29.8%. 

Alternatives to religious ceremonies are increasing across a number of categories, with civil and humanist ceremonies both observing increases.

Religious ceremonies still represent the majority of marriage ceremonies however at 61.2% of all marriages, down from 63% last year.

Your Voice
Readers Comments
18
This is YOUR comments community. Stay civil, stay constructive, stay on topic. Please familiarise yourself with our comments policy here before taking part.
Leave a Comment
    Submit a report
    Please help us understand how this comment violates our community guidelines.
    Thank you for the feedback
    Your feedback has been sent to our team for review.

    Leave a commentcancel