Advertisement

We need your help now

Support from readers like you keeps The Journal open.

You are visiting us because we have something you value. Independent, unbiased news that tells the truth. Advertising revenue goes some way to support our mission, but this year it has not been enough.

If you've seen value in our reporting, please contribute what you can, so we can continue to produce accurate and meaningful journalism. For everyone who needs it.
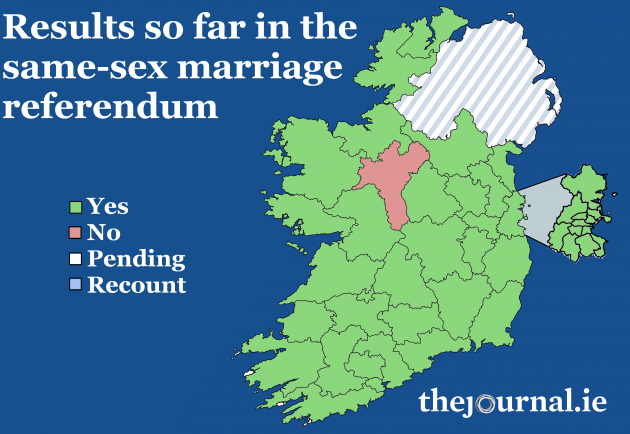
constituency count

How did your constituency vote in the marriage referendum?

Here’s how they voted where you’re from.

REF MAP TEMPLATE - SSMREF

IT’S BEEN AN emotional day for many as results from the same-sex marriage referendum revealed that Ireland has given a resounding YES.

While indications are that there was a landslide Yes vote in most constituencies, you might want to know how your own turned out.

Constituency count:

Carlow/Kilkenny Yes 56.2% No 43.8%

Cavan-Monaghan Yes 50.65% No 49.35%

Clare Yes 58.3% No 41.7%

Cork East Yes 61.7% No 38.3%

Cork North Central Yes 63.8% No 36.2%

Cork North West Yes 57.9% No 42.1%

Cork South Central Yes 65.8% No 34.2%

Cork South West Yes 56% No 44%

Donegal North East Yes 52.5% No 47.5%

Donegal South West Yes 50.1% No 49.9%

Dublin Central Yes 72.4% No 24.6%

Dublin Mid-West Yes 70.6% No 29.4%

Dublin North Yes 72.6% No 27.4%

Dublin North Central Yes 69% No 31%

Dublin North East Yes 66.7% No 33.3%

Dublin North West: Yes 70.4% No 29.6%

Dublin South Yes 69.9% No 30.1%

Dublin South Central Yes 72.3% No 27.7%

Dublin South East Yes 74.0% No 25.1%

Dublin South West Yes 71.3% 28.7%

Dublin West Yes 70.6% 29.4%

Dun Laoghaire Yes 71.6% No 28.4%

Galway East Yes 53.3% No 46.7%

Galway West Yes 61.5% No 38.5%

Kerry North-West Limerick Yes 55.5% No 44.5%

Kerry South 55.3% 44.7%

Kildare North Yes 69.7% No 30.3%

Kildare South Yes 66.2% No 33.8%6

Laois-Offaly Yes 56.8% No 43.2%

Limerick Yes 54.8% No 45.2%

Limerick City Yes 64.1% No 35.9%

Longford-Westmeath Yes 53.6% No 46.4%

Louth Yes 63.5% No 36.5%

Mayo Yes 52% No 48%

Meath East Yes 63.6% No 36.4%

Meath West Yes 60.1% No 39.9% 

Roscommon-South Letrim Yes 48.6% No 51.4%

Sligo-North Leitrim Yes 53.57% No 46.43%

Tipperary North Yes 56.12% No 45.3%

Tipperary South Yes 56.1% No 43.9%

Waterford Yes 60.33% No 39.67%

Wexford Yes 63.6% No 36.4%

Wicklow Yes 68.4% No 31.6% 

With reporting from Michael Shiels McNamee and Christina Finn

Read: LIVE: Counting underway in marriage referendum as tallies indicate it’s a YES

Also: The No campaign has accepted that they have lost the referendum

Readers like you are keeping these stories free for everyone...
A mix of advertising and supporting contributions helps keep paywalls away from valuable information like this article. Over 5,000 readers like you have already stepped up and support us with a monthly payment or a once-off donation.

Your Voice
Readers Comments
312
    Submit a report
    Please help us understand how this comment violates our community guidelines.
    Thank you for the feedback
    Your feedback has been sent to our team for review.
    JournalTv
    News in 60 seconds