Sign in. It’s quick, free and it’s up to you.
An account is an optional way to support the work we do. Find out more.
Sign in. It’s quick, free and it’s up to you.
An account is an optional way to support the work we do. Find out more.
EARLY IN DECEMBER, we asked if you had any nagging questions remaining from 2016, about claims or facts or statistics you heard again and again over the course of the past 12 months.
We were inundated with excellent suggestions from readers, and picked out the very best ones.
For the fourth and final installment, we’re looking at “real unemployment”, workers on employment activation, and the nature of the jobs held in Ireland at the moment.
We had two similar suggestions on this: one from @mdmak33 in the comments section, and one by email from another reader.
Here’s the official unemployment rate in Ireland, over the past 10 years – seasonally adjusted, from the CSO’s QNHS (Quarterly National Household Survey).
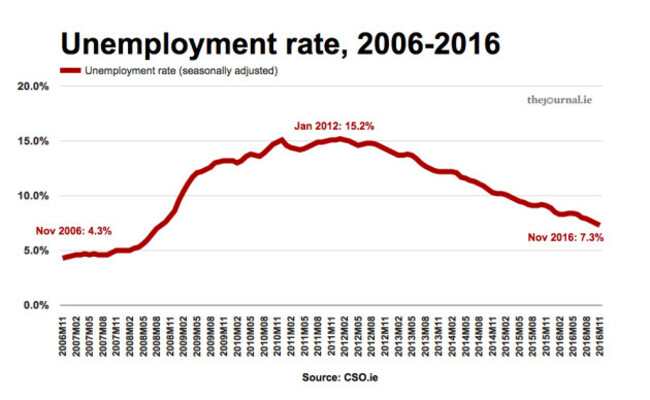
This figure is measured, following the ILO (International Labour Organisation) classification, as: “The number of unemployed expressed as a percentage of the total labour force” aged between 15 and 74.
According to the most recent figures, for November, the unemployment rate was 7.3%, the lowest it has been since September 2008, after which it reached a peak of 15.2% in January 2012.
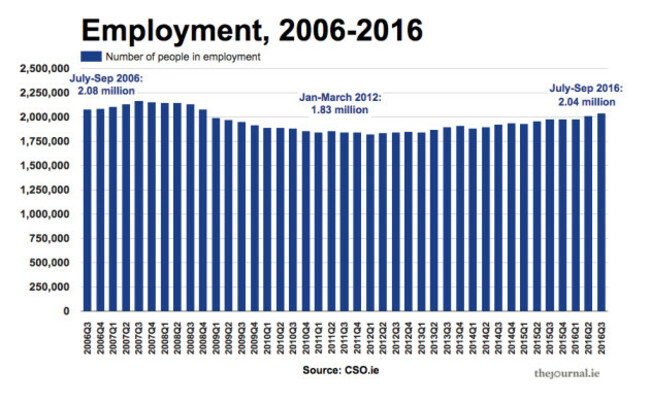
And here’s how the number of people employed has changed over the same period.
Persons “in employment” again follows the ILO classification, and is defined by the CSO as:
Persons who worked in the week before the survey for one hour or more for payment or profit, including work on the family farm or business and all persons who had a job but were not at work because of illness, holidays etc. in the week.
According to the most recent figures (Quarter 3 2016, or July-September), there were 2,040,500 people at work in Ireland.
That’s the highest since Quarter 4 2008, after which it fell to its lowest point in the last decade – 1,825,000 in Quarter 1 2012.
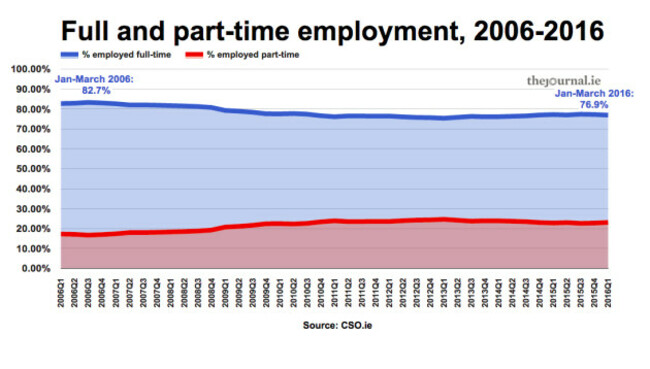
The data for this is only available up to Quarter 1 (January-March) of 2016, so we’re starting at Quarter 1 2006. These figures are taken from the QNHS Detailed Employment Series.
As you can see, there hasn’t been an enormous change in the proportion of workers with full-time status, over the past 10 years, and almost none at all over the past five years.
In Quarter 1 2016, 76.9% of those in employment were working full-time, while that figure was 76.1% in the same period in 2011, but it was 82.7% in Quarter 1 2006.
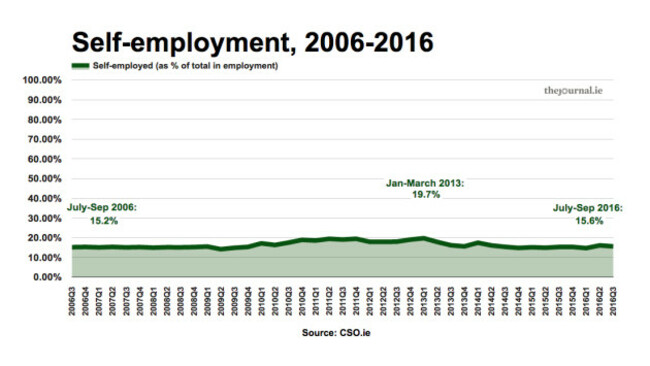
Similarly, there hasn’t been a drastic change in the percentage of workers who are self-employed, in the past 10 years, as this chart shows.
In Quarter 3 2016, there were 318,300 individuals classed as self-employed – 15.6% of all those in employment.
In Quarter 3 2011, the figure was 352,000, or 19.1% of those employed. And in Quarter 3 2006, the number of self-employed was 315,700 – some 15.2% of the total number employed.
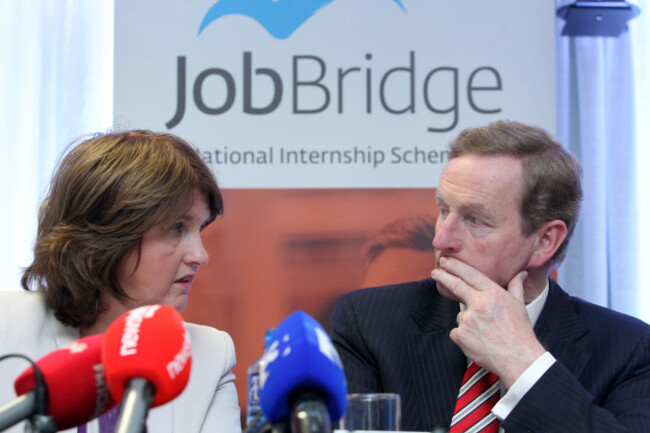
This is often the subject of queries to FactCheck, as well as claims that the number of people on job activation schemes like JobBridge is masking the reality of unemployment in Ireland.
So we’ve gone back through the figures dating from February 2011, to see how many people have been on job activation schemes.
These individuals are not counted towards unemployment and the live register, and most of them are counted in the employment figures.
We examined this very issue in a more in-depth fact check, back in February, but we have more up-to-date figures now.
Unemployment
Let’s see what unemployment would look like if we added those on job activation schemes.
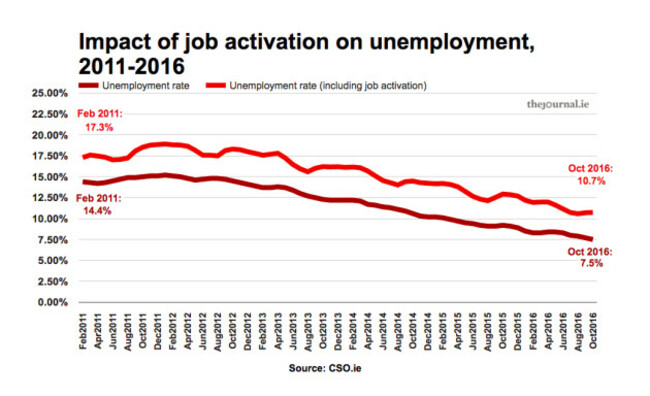
As you can see, the number on job activation schemes does have a significant impact, adding between 2.3 and 4.2 percentage points to the unemployment rate.
The impact of job activation was particularly pronounced during the spring of 2015, with theoretical added unemployment of between 4.1 and 4.2 percentage points in March, April and May.
Employment
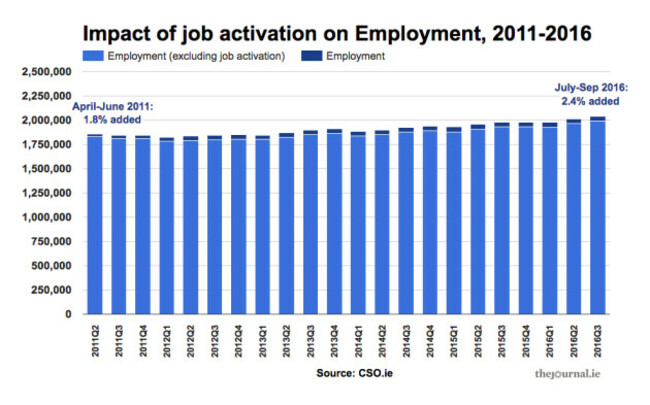
The effect here is slightly more muted, since two particular job activation schemes are not counted as employment (Solas and Back to Education), because they involve allowances for training and education (as opposed to work).
Since the CSO’s Detailed Employment Series is quarterly, we’ve averaged out the job activation numbers to produce a quarterly figure.
Job activation has added a maximum of 2.6% to the number of people in employment, since 2011.
TheJournal.ie’s FactCheck is a signatory to the International Fact-Checking Network’s Code of Principles. You can read it here.
For information on how FactCheck works, what the verdicts mean, and how you can take part, check out our Reader’s Guide here.

To embed this post, copy the code below on your site












have your say