Sign in. It’s quick, free and it’s up to you.
An account is an optional way to support the work we do. Find out more.
Sign in. It’s quick, free and it’s up to you.
An account is an optional way to support the work we do. Find out more.
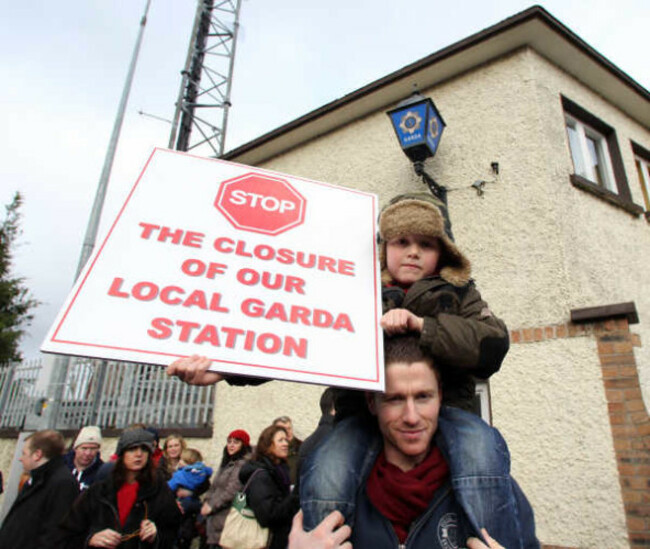
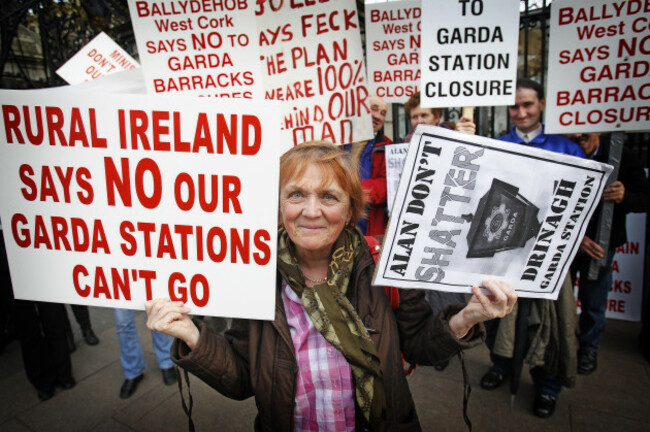
THE ISSUE OF rural crime was front and centre of the recent general election campaign, especially in light of the closure of 139 garda stations between 2012 and 2013.
Reversing those closures, and tackling crime in rural areas, also played a role in negotiations over the formation of a new government, and Fine Gael has agreed to re-open six stations as part of the programme for government (page 98).
What effect has the closure of those 139 stations had on crime in Ireland?
In January, Fianna Fáil’s Mayo TD Dara Calleary pointed to what he called “the impact of garda station closures on soaring crime rates and community decline,” and stated:
The fact is that since 139 garda stations were closed by Fine Gael, burglaries and other crimes have soared.
Last October, Kerry TD Michael Healy-Rae claimed the closures had “directly resulted in a massive rise in rural crime…”
On the other hand, Newstalk reported last December that Garda Commissioner Nóirín O’Sullivan had denied the station closures were causing a rise in crime.
And in the Dáil in January, Justice Minister Frances Fitzgerald said:
While crime trends continue to be monitored closely by local garda management, I am advised that the available data does not point to a correlation between the closure of garda stations and increased crime rates.
So, what is the truth?
Paul Rafferty in Dublin emailed us to ask this very question, so we gathered the data, crunched the numbers, and here’s what we found.
(Remember, if you see a claim that sounds dodgy, email factcheck@thejournal.ie).
Claim: Crime has increased since 139 garda stations were closed
Verdict: Almost entirely FALSE.
Two quick note before we start. First, this article is not going to make any causal claims about garda station closures and crime rates.
We simply don’t have access to the kind of information (hundreds of thousands of garda incident reports, for starters) which would allow us to identify and count the number of crimes that may not have happened if certain garda stations had not been shut down.
All we can do is look at any potential links between garda station closures and changes in crime rates. We’re dealing with correlation, here, not causation, and statistics, rather than anecdotal evidence.
Second, while there have been recent issues in gathering crime statistics, there is no evidence that crime trends between months and years – which is the subject of this article – would be affected. However, the figures should be viewed with that in mind.
The Basics
Since 2012, 139 garda stations have been closed.
For our analysis, we’ve looked at the two major closures – of 37 stations in 2012, and 97 in 2013.
We gathered recorded crime statistics from the CSO for every quarter between 2009 and 2015, grouped in 14 major categories of crime (which you can read about here), and broken down by all 28 garda divisions across the country.
Here are the results.
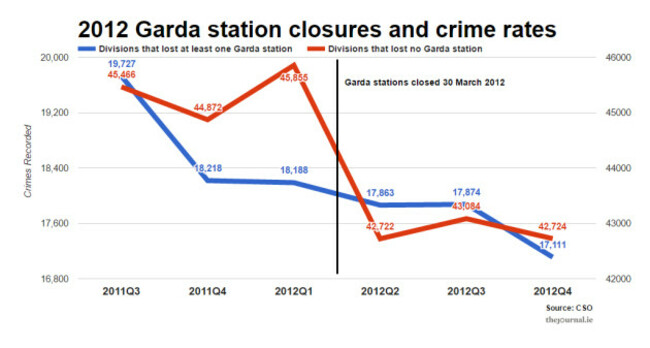
So in the months following the closure of 37 garda stations in March/April 2012, the crime rate went down nationally.
And it actually fell at a slightly faster rate in those divisions that had lost at least one station.
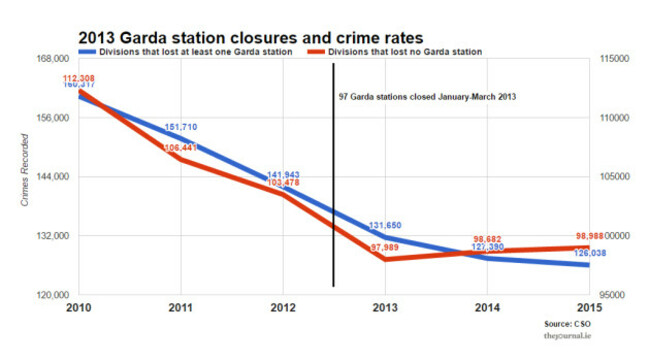
Because the closure of 97 stations took place at the start of 2013 (95 in January and two more in February and March), we can fairly compare crime rates from 2010-2012 and 2013-2015.
So in the three years since 97 garda stations were closed, in January-March 2013, crime has gone down nationally.
And the crime rate has fallen almost twice as much in garda divisions that lost at least one station in 2013.
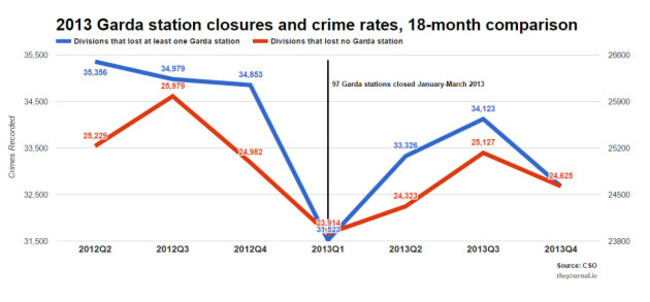
Let’s get even more specific, though, and isolate the months surrounding the closure of those 97 stations.
As you can see, there was a significant increase in the crime rate in the six months following the closure of the garda stations, which happened in the first quarter of 2013.
And that increase was more pronounced in divisions that had lost at least one station.
However, the crime rate in Q1 2013 had itself dipped significantly from the six preceding months, and so constituted a particularly low base from which crime increased in the second and third quarters of 2013.
All told:
So in the more immediate aftermath of the 97 garda station closures, crime fell nationally, and it fell most in divisions that lost a station.

However, not every garda division lost the same number of stations. For example, the Sligo-Leitrim division lost one third of its stations (nine) in the closures of of 2013, while Wexford lost 4.2% (one station).
Also, the crime rate did increase slightly in a few divisions after the two rounds of closures.
After the 2012 closures, crime increased slightly in two divisions that lost at least one station – Mayo and Roscommon-Longford, and in three divisions that didn’t lose a station – Louth, Galway and Westmeath.
After the 2013 closures, crime increased slightly in only one division – Dublin North Central, which didn’t lose a station.
You can check each division’s crime rates in the spreadsheet further down.
So let’s drill down a bit more, and see whether there was a link between the percentage of garda stations lost by divisions in 2012 and 2013 (and not just whether or not they lost at least one) and the crime rate in those divisions afterwards.
We took the number of garda stations and crimes in each division in the nine months leading up to and following both the 2012 and 2013 closures, and calculated the percentage changes in each.
We calculated that the correlation between changing station numbers and changing crime rates around the 2012 and 2013 closures was statistically indistinguishable from 0.
What that means is that there was no link between changes in the number of Garda stations and changes in the crime rate, before and after both waves of closures.
But what about specific crimes?
We checked that too, comparing crime rates from the nine months before and after the March/April 2012 closures, and the three years before and after the January 2013 closures.
Here’s what we found.
The CSO figures gave a breakdown for 14 categories of crime.
The number of homicides and kidnapping offences were too small to draw any inferences from them, but you can find all the data in the spreadsheet below.
You can see details of crime in those 12 categories, here.
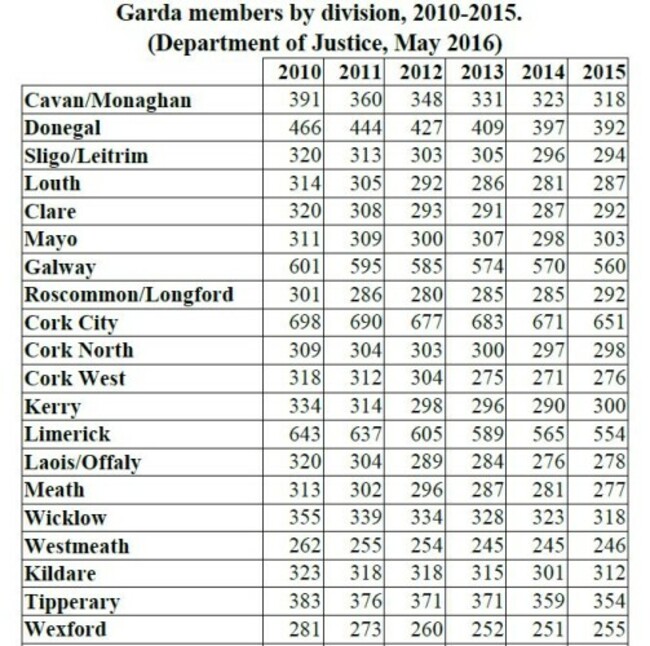
We were also curious about a possible link between the changing number of garda members in each division (as opposed to stations), and the crime rates there.
This is because, while some divisions kept all their stations, they lost significant numbers of gardaí. For example, the West Dublin division lost no stations between 2010 and 2015, but lost 25% of its garda members.
The Kildare division lost 16.7% of its garda stations between 2010 and 2015, but lost only 3.4% of its gardaí in the same period.
We got the number of garda members in each division from 2010-2015 from the Department of Justice, and found that, nationally, there was an 11.5% drop in that five year period, from 12,342 in 2010 to 10,914 last year.
The overall national crime rate fell by 17.5% in the same period.
We tracked the changes in garda numbers and crime rates in each division each year, and here’s what we found:

The national crime rate fell after both sets of closures, and fell hardest in areas that lost stations.
However, we saw that there was no statistically significant correlation whatsoever between the number of garda stations in divisions, and crime rates there, before and after the two waves of closures.
Remember though, we’re not saying that the closure of the garda stations caused that drop in crime.
It’s possible that the decrease in crime would have been even greater in divisions that lost stations, if they hadn’t lost those stations, and that the crime rate fell despite the closures, rather than because of them.
So why did crime fall hardest in areas that lost stations? We don’t know, but here are two possible explanations.
The Dublin Factor
There may be characteristics of the garda divisions where crime fell that are completely separate to whether or not they lost a garda station, but could account for the decrease.
For example, the Dublin Metropolitan Region was almost entirely unaffected by both phases of station closures, and made up a large part of the “didn’t lose a station” groupings in the Closures of 2012 and Closures of 2013, above.
Social, economic and criminal trends in and around the capital, potentially unique to Dublin, could therefore have contributed to a slower decline in crime rates among garda divisions that didn’t lose any stations.
And conversely, this could explain why garda divisions that did lose stations (mainly rural areas) experienced a greater decline in crime rates.
Garda numbers in the Dublin Metropolitan Region could also potentially have played a role. Between 2010 and 2015, the number of gardaí in Dublin divisions fell by 16.1%, even though the number of stations fell by just 4.7% (Stepaside and Kill O’The Grange).
By contrast, the rest of the country lost 9.3% of its gardaí, but 19.6% of its garda stations.
This significant loss of gardaí in Dublin, while retaining almost all stations, could also have contributed to the the slower fall in crime rates among divisions that lost no stations in 2012 and 2013.
Efficiency and rationalisation
We have no evidence either way on this, but it could also be the case that the closure of certain Garda stations has facilitated a rationalisation and re-focus of Garda resources in some areas, allowing for greater efficiency.
Justice Minister Frances Fitzgerald made that argument in answer to parliamentary questions earlier this month, stating:
The Garda authorities would say that the new arrangements have allowed front-line gardaí to be managed with greater flexibility and mobility and in a more focused fashion, particularly with regard to various targeted police operations.
And why did the crime rate fall nationally while the number of garda stations and gardaí diminished on a national level?
Again, we don’t know, but there were probably several contributing factors. Here’s one plausible hypothesis.
The economy
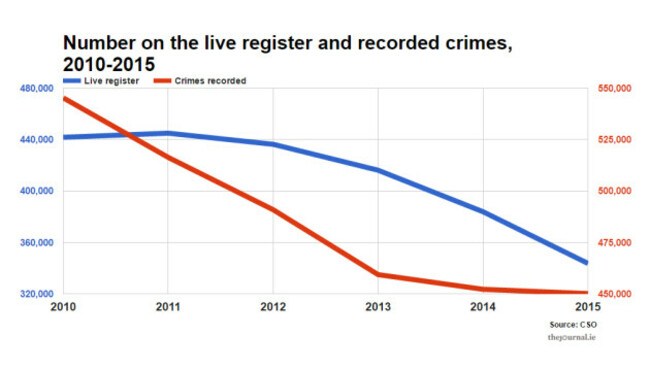
It is a generally accepted principle that overall crime rates rise and fall as unemployment rises and falls.
According to CSO figures:
Between 2010 and 2015, the number of individuals signing onto the live register dropped by 22.2%. Over the same time, the number of crimes recorded fell by 17.4%.
Even if we add those on job activation schemes like JobBridge to the equation, the decrease was 16.7% between February 2010 (the earliest month available that year) and December 2015.
So it could well be that as tens of thousands of people returned to work in the last few years, the economic factors known to drive crime (particularly property-related crime) dissipated, and the crime rate dropped as a result.
This is only speculation, though.
A far more detailed analysis involving garda files, trends specific to Dublin, and county-by-county employment statistics would be required to properly explain why crime fell after the station closures, and why it fell most where the closures took place.
But fall it did. In only one of the 12 categories of crime analysed was there an increase in divisions that lost a station, in the months and years after the two waves of closures.
That was the category including organised crime and court order violations (although the overwhelming majority of the increase was made up of court order violations).
And in only two divisions that lost stations was there a small increase in crime after the 2012 closures.
Therefore, the claim – that there has been an increase in crime since the closure of 139 garda stations – is almost entirely FALSE.
To download a spreadsheet containing all the relevant data, click here.
Send your FactCheck requests to factcheck@thejournal.ie

To embed this post, copy the code below on your site
















have your say