Advertisement

We need your help now

Support from readers like you keeps The Journal open.

You are visiting us because we have something you value. Independent, unbiased news that tells the truth. Advertising revenue goes some way to support our mission, but this year it has not been enough.

If you've seen value in our reporting, please contribute what you can, so we can continue to produce accurate and meaningful journalism. For everyone who needs it.

USA

These maps show 21 highly segregated USA cities

Analysis of the 2010 Census data shows how major cities are still segregated by neighbourhood a half century after the civil rights movement.

RACIAL SEGREGATION REMAINS an issue in America, and it’s lasting longer than anyone expected.

Just how bad things are can be determined through analysis of 2010 Census data.

The average black person lives in a neighbourhood that is 45 percent black. Without segregation, his neighbourhood would be only 13 per cent black, according to professors John Logan and Brian Stults at Brown and Florida State.

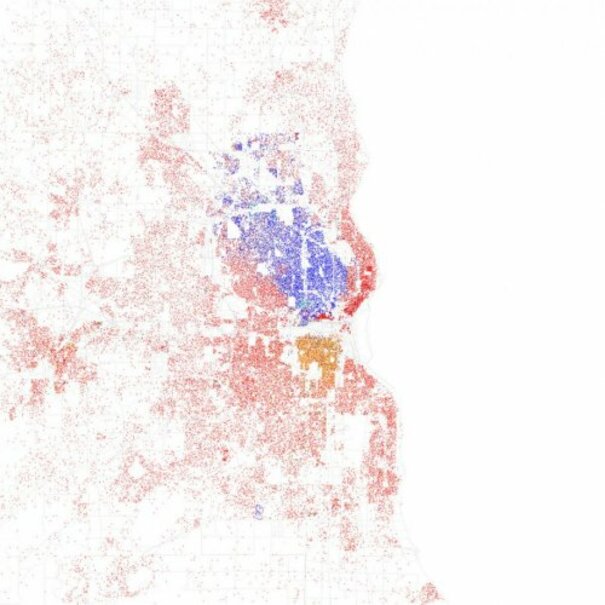
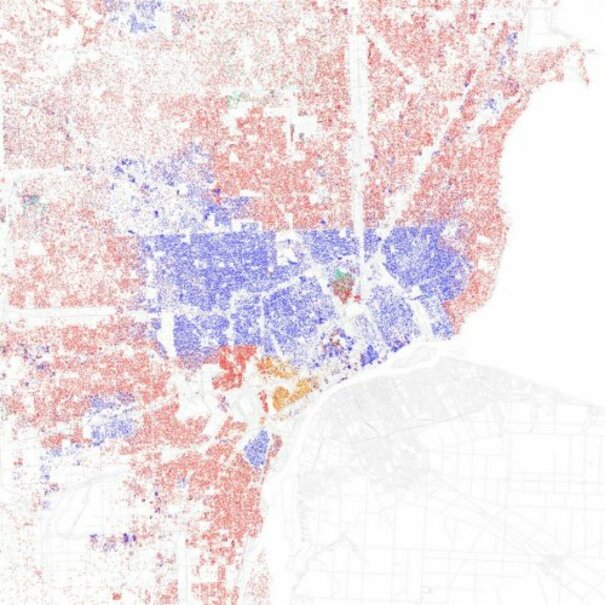
Logan and Stult evaluated segregation in major cities with a dissimilarity index, which identifies the percentage of one group that would have to move to a different neighborhood to eliminate segregation. A score above 60 on the dissimilarity index is considered extreme.

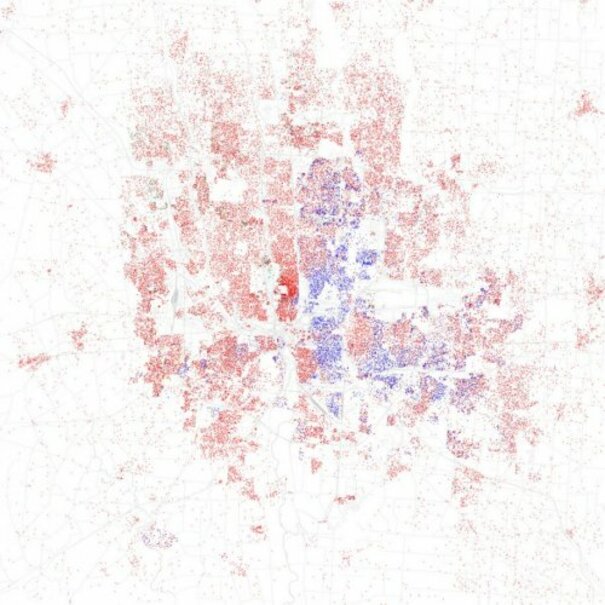
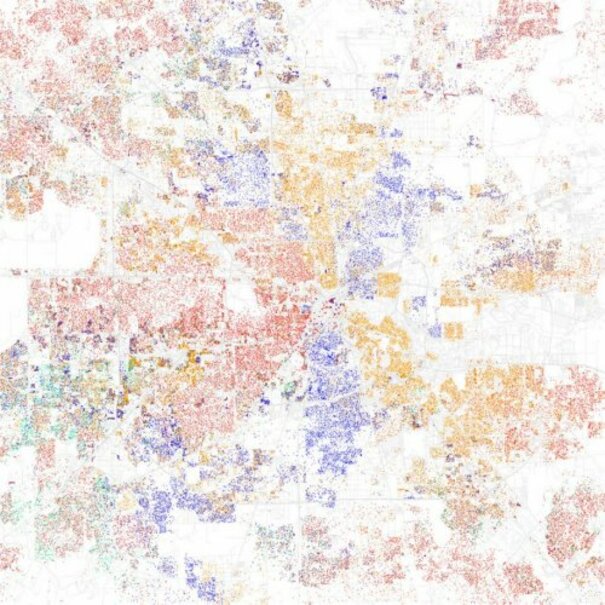
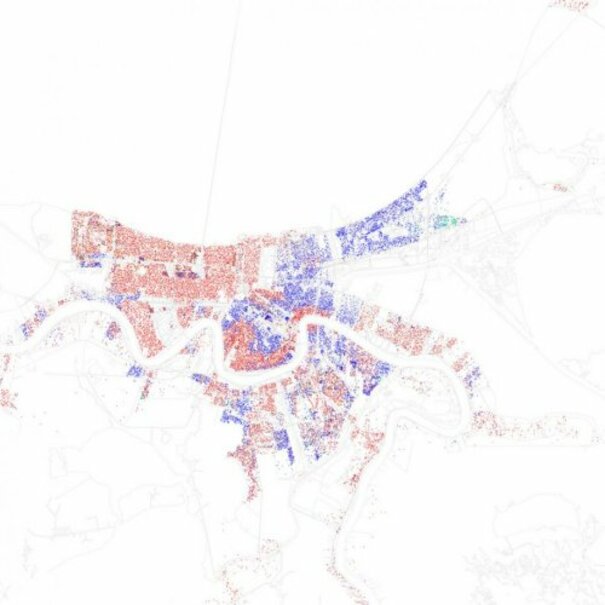
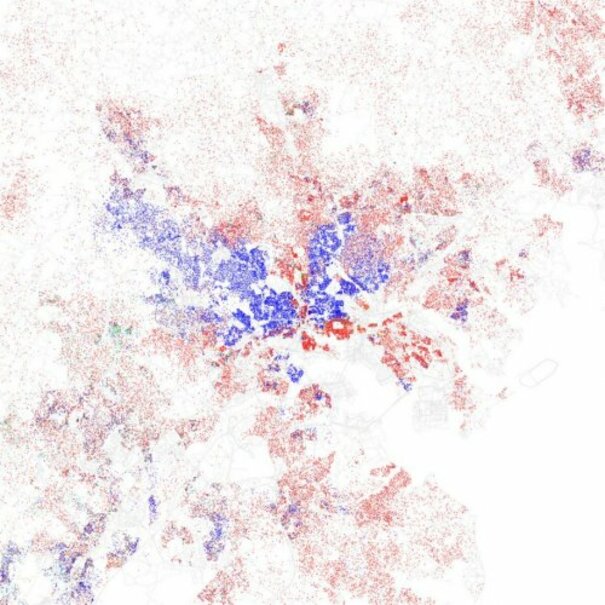
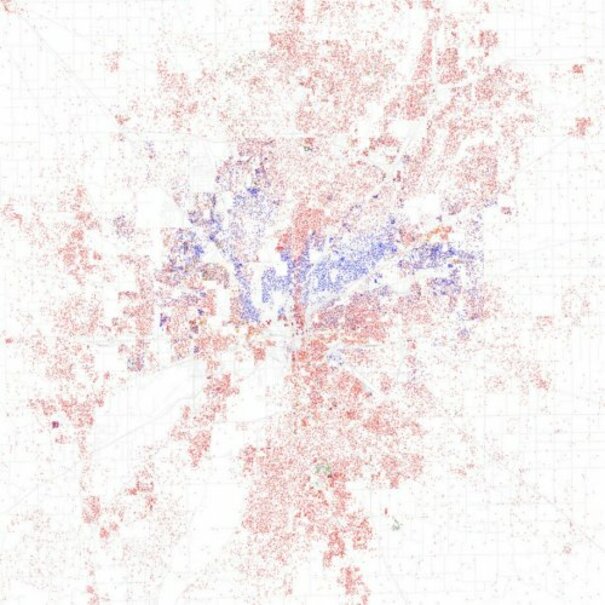
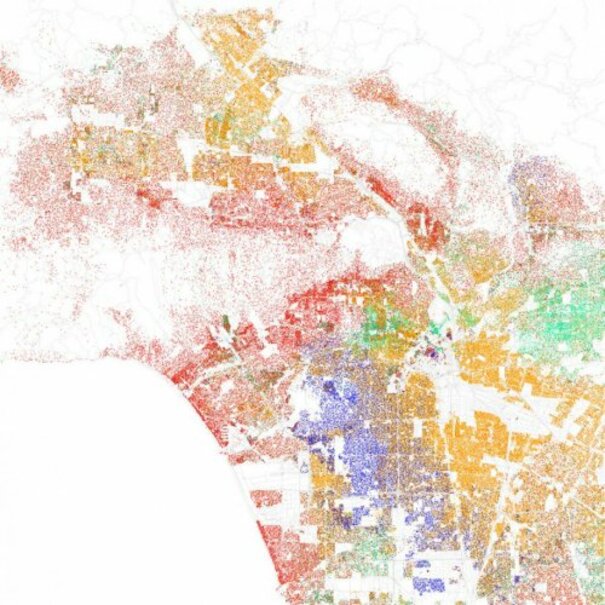
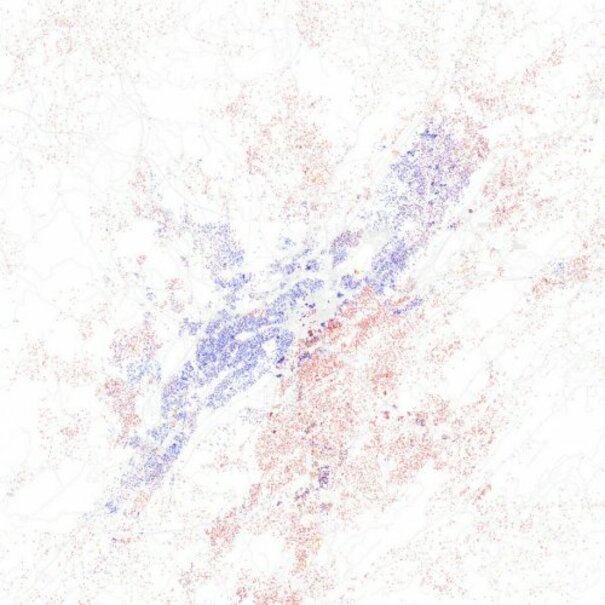
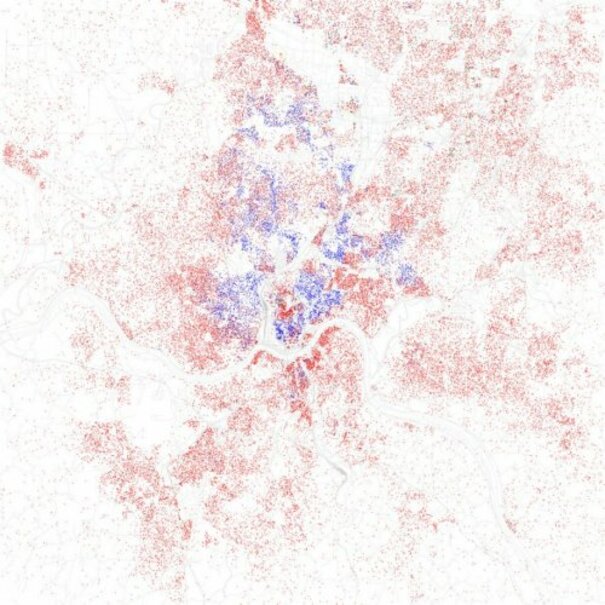
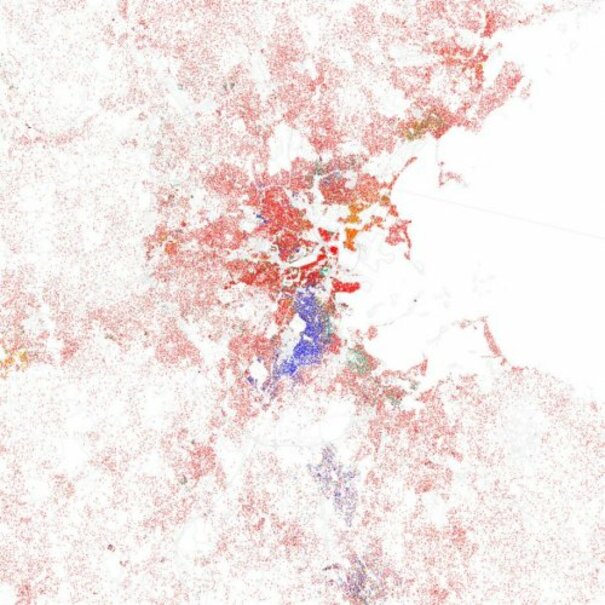
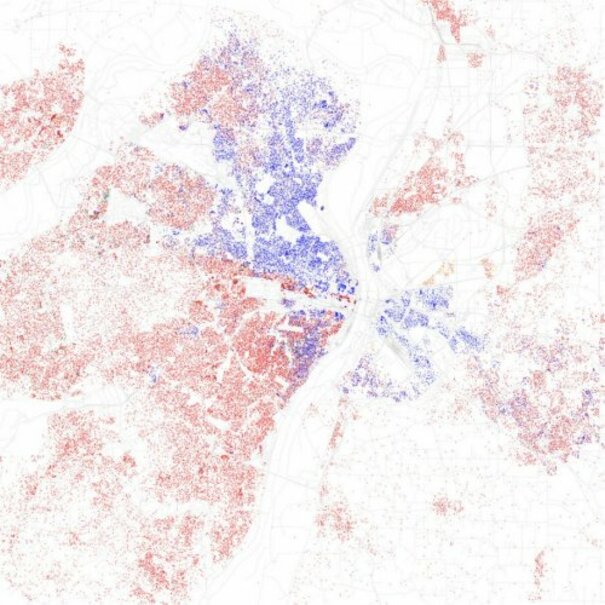
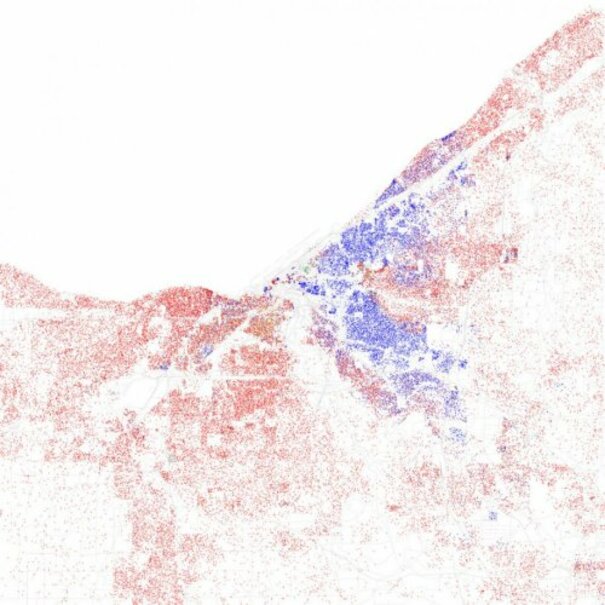
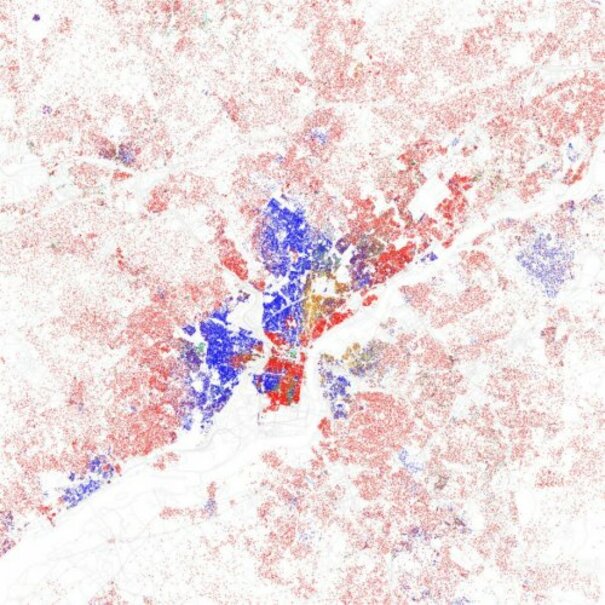
In the following slides, we have ranked the most segregated cities in ascending order. They are illustrated with maps of cities by race created by Eric Fischer and publicly available on Flickr. The red dots show white people, blue is black, orange is Hispanic, green is Asian, and yellow is other.

These maps show 21 highly segregated USA cities
1 / 21
  • Columbus, Ohio - African-Americans cluster in inner city

    Columbus's black-white dissimilarity score is 59.9, according to a study of 2010 Census data by professors John Logan and Brian Stults of Brown and Florida State University. A score above 60 on the dissimilarity index is considered very high segregation. The red dots show white people, blue is black, orange is Hispanic, green is Asian, and yellow is other, according to maps of 2010 Census data by Eric Fischer.
  • Houston, Texas - Separate communities fan out

    Houston's black-white dissimilarity score is 60.6, according to a study of 2010 Census data by professors John Logan and Brian Stults of Brown and Florida State University. A score above 60 on the dissimilarity index is considered very high segregation. The red dots show white people, blue is black, orange is Hispanic, green is Asian, and yellow is other, according to maps of 2010 Census data by Eric Fischer.
  • Memphis, Tennessee - Blacks and whites highly segregated

    Memphis's black-white dissimilarity score is 60.6, according to a study of 2010 Census data by professors John Logan and Brian Stults of Brown and Florida State University. A score above 60 on the dissimilarity index is considered very high segregation. The red dots show white people, blue is black, orange is Hispanic, green is Asian, and yellow is other, according to maps of 2010 Census data by Eric Fischer.
  • Pittsburgh, Pennsylvania - African-Americans mostly in areas on east side

    Pittsburgh's black-white dissimilarity score is 63.1, according to a study of 2010 Census data by professors John Logan and Brian Stults of Brown and Florida State University. A score above 60 on the dissimilarity index is considered very high segregation. The red dots show white people, blue is black, orange is Hispanic, green is Asian, and yellow is other, according to maps of 2010 Census data by Eric Fischer.
  • New Orleans, Louisiana - While Hurricane Katrina led to a decline in segregation...

    ...many wards still remain highly specific to race. New Orleans's black-white dissimilarity score is 63.3, according to a study of 2010 Census data by professors John Logan and Brian Stults of Brown and Florida State University. A score above 60 on the dissimilarity index is considered very high segregation. The red dots show white people, blue is black, orange is Hispanic, green is Asian, and yellow is other, according to maps of 2010 Census data by Eric Fischer.
  • Washington DC - The red dots denote the largely white downtown

    The D.C. metropolitan area's black-white dissimilarity score is 64.1, according to a study of 2010 Census data by professors John Logan and Brian Stults of Brown and Florida State University. A score above 60 on the dissimilarity index is considered very high segregation. The red dots show white people, blue is black, orange is Hispanic, green is Asian, and yellow is other, according to maps of 2010 Census data by Eric Fischer.
  • Baltimore, Maryland - The inner city and western suburbs are mainly black populations

    Baltimore's black-white dissimilarity score is 64.3, according to a study of 2010 Census data by professors John Logan and Brian Stults of Brown and Florida State University. A score above 60 on the dissimilarity index is considered very high segregation. The red dots show white people, blue is black, orange is Hispanic, green is Asian, and yellow is other, according to maps of 2010 Census data by Eric Fischer.
  • Indianapolis, Indiana - Black people live mainly in the northern part

    Indianapolis's black-white dissimilarity score is 64.5, according to a study of 2010 Census data by professors John Logan and Brian Stults of Brown and Florida State University. A score above 60 on the dissimilarity index is considered very high segregation. The red dots show white people, blue is black, orange is Hispanic, green is Asian, and yellow is other, according to maps of 2010 Census data by Eric Fischer.
  • Los Angeles, California - White people cling to the coast and the north at Hollywood Hills

    L.A.'s black-white dissimilarity score is 65.0, according to a study of 2010 Census data by professors John Logan and Brian Stults of Brown and Florida State University. A score above 60 on the dissimilarity index is considered very high segregation. The red dots show white people, blue is black, orange is Hispanic, green is Asian, and yellow is other, according to maps of 2010 Census data by Eric Fischer.
  • Birmingham, Alabama - Racial segregation occurs on either side of the I-59 highway

    Birmingham's black-white dissimilarity score is 65.2, according to a study of 2010 Census data by professors John Logan and Brian Stults of Brown and Florida State University. A score above 60 on the dissimilarity index is considered very high segregation. The red dots show white people, blue is black, orange is Hispanic, green is Asian, and yellow is other, according to maps of 2010 Census data by Eric Fischer.
  • Cincinnati, Ohio - Black people live downtown; whites stick to the south and outskirts

    Cincinnati's black-white dissimilarity score is 66.9, according to a study of 2010 Census data by professors John Logan and Brian Stults of Brown and Florida State University. A score above 60 on the dissimilarity index is considered very high segregation. The red dots show white people, blue is black, orange is Hispanic, green is Asian, and yellow is other, according to maps of 2010 Census data by Eric Fischer.
  • Boston, Massachusetts - Black people live almost exclusively southside

    Boston's black-white dissimilarity score is 67.8, according to a study of 2010 Census data by professors John Logan and Brian Stults of Brown and Florida State University. A score above 60 on the dissimilarity index is considered very high segregation. The red dots show white people, blue is black, orange is Hispanic, green is Asian, and yellow is other, according to maps of 2010 Census data by Eric Fischer.
  • St Louis, Missouri - A north-south divide

    St Louis's black-white dissimilarity score is 69.2, according to a study of 2010 Census data by professors John Logan and Brian Stults of Brown and Florida State University. A score above 60 on the dissimilarity index is considered very high segregation. The red dots show white people, blue is black, orange is Hispanic, green is Asian, and yellow is other, according to maps of 2010 Census data by Eric Fischer.
  • Cleveland, Ohio - An east-west divide

    Cleveland's black-white dissimilarity score is 72.6, according to a study of 2010 Census data by professors John Logan and Brian Stults of Brown and Florida State University. A score above 60 on the dissimilarity index is considered very high segregation. The red dots show white people, blue is black, orange is Hispanic, green is Asian, and yellow is other, according to maps of 2010 Census data by Eric Fischer.
  • Miami, Florida - LIttle Haiti, Wynwood, Little Havana, West Miami, Coral Way, Brownsville stand out

    Miami's black-white dissimilarity score is 73.0, according to a study of 2010 Census data by professors John Logan and Brian Stults of Brown and Florida State University. A score above 60 on the dissimilarity index is considered very high segregation. The red dots show white people, blue is black, orange is Hispanic, green is Asian, and yellow is other, according to maps of 2010 Census data by Eric Fischer.
  • Philadelphia, Pennsylvania

    North and West Philadelphia remain stayed heavily black, with a pocket of Hispanics. White people stick to South and Northeast Philly and the suburbs. Philadelphia's black-white dissimilarity score is 73.7, according to a study of 2010 Census data by professors John Logan and Brian Stults of Brown and Florida State University. A score above 60 on the dissimilarity index is considered very high segregation. The red dots show white people, blue is black, orange is Hispanic, green is Asian, and yellow is other, according to maps of 2010 Census data by Eric Fischer.
  • Chicago, Illinois - There is a wide segregation of several ethnicities

    Chicago's black-white dissimilarity score is 75.9, according to a study of 2010 Census data by professors John Logan and Brian Stults of Brown and Florida State University. A score above 60 on the dissimilarity index is considered very high segregation. The red dots show white people, blue is black, orange is Hispanic, green is Asian, and yellow is other, according to maps of 2010 Census data by Eric Fischer.
  • Newark, New Jersey - Downtown Newark has a mainly black population

    Newark's black-white dissimilarity score is 78.0, according to a study of 2010 Census data by professors John Logan and Brian Stults of Brown and Florida State University. A score above 60 on the dissimilarity index is considered very high segregation. The red dots show white people, blue is black, orange is Hispanic, green is Asian, and yellow is other, according to maps of 2010 Census data by Eric Fischer.
  • New York - Manhattan and Brooklyn are most heavily segregated

    Most of Manhattan is white south of 125th Street, with the exception of Chinatown. South Brooklyn is mostly white, with pockets of Asians and Hispanics, and Northeast Brooklyn going into Queens is heavily black. Queens and the Bronx are highly diverse. The New York City area's black-white dissimilarity score is 79.1, according to a study of 2010 Census data by professors John Logan and Brian Stults of Brown and Florida State University. A score above 60 on the dissimilarity index is considered very high segregation. The red dots show white people, blue is black, orange is Hispanic, green is Asian, and yellow is other, according to maps of 2010 Census data by Eric Fischer.
  • Milwaukee, Wisconsin - white population stays in the suburbs

    Milwaukee's black-white dissimilarity score is 79.6, according to a study of 2010 Census data by professors John Logan and Brian Stults of Brown and Florida State University. A score above 60 on the dissimilarity index is considered very high segregation. The red dots show white people, blue is black, orange is Hispanic, green is Asian, and yellow is other, according to maps of 2010 Census data by Eric Fischer.
  • Detroit, Michigan - the most segregated city in America

    Detroit's inner city is almost exclusively black, except for a small Hispanic corner in the southwest called "Mexicantown." The suburbs like Grosse Pointe, Dearborn, and Ferndale are heavily white. Detroit's black-white dissimilarity score is 79.6, according to a study of 2010 Census data by professors John Logan and Brian Stults of Brown and Florida State University. A score above 60 on the dissimilarity index is considered very high segregation. The red dots show white people, blue is black, orange is Hispanic, green is Asian, and yellow is other, according to maps of 2010 Census data by Eric Fischer.

- Rebecca Baird-Remba and Gus Lubin

Published with permission from
Business Insider
Your Voice
Readers Comments
61
    Submit a report
    Please help us understand how this comment violates our community guidelines.
    Thank you for the feedback
    Your feedback has been sent to our team for review.