Advertisement

We need your help now

Support from readers like you keeps The Journal open.

You are visiting us because we have something you value. Independent, unbiased news that tells the truth. Advertising revenue goes some way to support our mission, but this year it has not been enough.

If you've seen value in our reporting, please contribute what you can, so we can continue to produce accurate and meaningful journalism. For everyone who needs it.

FACTCHECK

Debunked: Is 2020 really a 'normal' year for deaths from respiratory illnesses?

A post on Facebook claims there are no more deaths ‘than usual’ as a result of Covid-19.

CoronaFC banner

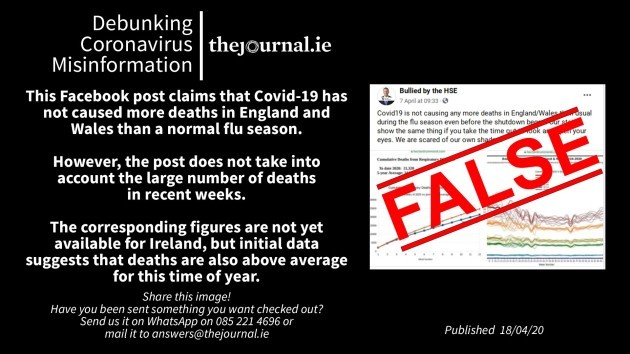
A POST ON Facebook claims that the number of deaths from respiratory illnesses in Ireland is normal when compared with other years.

The post also claims that Covid-19 is not causing any more deaths in England and Wales than usual and that the number of deaths from respiratory illnesses there is actually less than average. 

The claim, which was first posted on Facebook, reads:

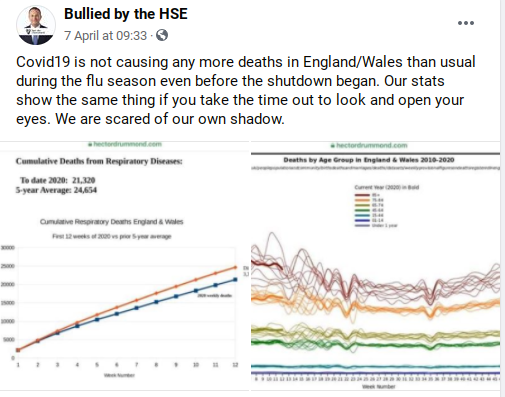
Covid-19 is not causing any more deaths in England/Wales than usual during the flu season even before the shutdown began. Our stats show the same thing if you take the time out to look and open your eyes. We are scared of our own shadow. 

Screenshot 2020-04-16 at 6.34.35 PM Facebook Facebook

The post, which was shared in an Irish group called Bullied by the HSE on 7 April, also showed two graphs, both of which compare the number of deaths this year in England and Wales with previous years.

The graphs appear to show that Covid-19 is not having a significant impact on death rates at a national level in the UK. But how accurate is it to suggest that the coronavirus isn’t having an impact?

UK figures

The claim that Covid-19 is not causing any more deaths than normal is based on two graphs, both of which appear to be lifted from a UK-based blog.

In a post on 1 April, the author shared a series of graphs (supplied to him by two contributors) to claim that an expected increase in deaths from Covid-19 in England and Wales had not yet materialised.

One graph – later shared on Facebook – attempts to show that the death rates among the “very old” in the UK (described as those aged 85 and over) are seasonal and vary significantly year to year.

It shows the total number of weekly deaths in the UK and Wales, stratified by age group, between 2010 and 2020.

Lines representing 2020 are also highlighted, showing that the number of deaths in each age group was not higher than in previous years.

ONS_EW_AllAgeDeaths-2010-2020 Facebook Facebook

According to the author of the blog, the graph shows that “there is no sign whatsoever of a killer in that data” and that “it’s a perfectly normal year.”

The data in the graph was sourced from the Office for National Statistics (ONS), the UK’s equivalent to the Central Statistics Office.

And an examination of the relevant ONS data on deaths registered weekly in England and Wales does show that the graph is accurate.

During the first twelve weeks of the year, the number of deaths in England and Wales was not a significant increase on the number of deaths over the same period from 2010 to 2019.

And it’s true that more people aged between 75-84 and over 85 have died in England and Wales in other years compared with this year.

As the graph shows, there were spikes in weeks 2 to 5 among both age groups in 2015, and a similar spike among the over 85s during the same period in 2018.

Impact of Covid-19

When it comes to the Covid-19 pandemic, the graph doesn’t quite tell the full story.

The first case of Covid-19 in the UK was confirmed on 31 January, and the first death wasn’t confirmed until 5 March – the 10th week of 2020.

That means that any impact of Covid-19 on the number of deaths in 2020 would only be seen in the 10th, 11th and 12th weeks, when four, 35 and 374 deaths were recorded respectively.

But such relatively small numbers wouldn’t impact on a graph showing all weekly deaths across England and Wales.

That’s because that graph contains statistics from pretty much every other possible form of death (such as cancer and heart attacks).

For context, between 2011 and 2019, the average number of deaths from all causes during week 10 in the UK and Wales was 10,845.

During week 11, the average number of deaths from all causes over the 9-year period was 10,680; and in week 12 it was 10,290.

It was only in weeks 13 and 14 when the number of Covid-19 deaths began to significantly increase in the UK, that the impact of the coronavirus on death statistics became apparent.

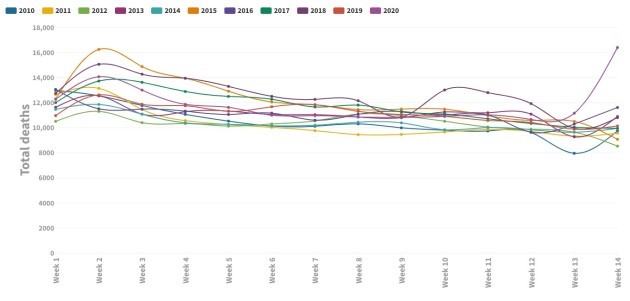
Here’s a graph showing the total number of deaths from weeks 1 to 14, covering 2010 to 2020:

UK total deaths by week, 2010-2020 TheJournal.ie TheJournal.ie

Note the jump at the very end, representing weeks 13 and 14 in 2020.

In fact, the total number of deaths in week 14 this year was higher than in any other week from January to April since the beginning of 2010.

It’s worth pointing out that the number of deaths in the UK is continuing to rise, and could be even higher if restrictions on movement and gatherings were not introduced there last month.

It’s true that the number of deaths at the peak of this year’s flu season, which usually happens between December and February in England and Wales, was not higher than in other years.

And it may have been accurate to say “it’s a perfectly normal year” in week 12, when the coronavirus didn’t have an impact.

But Covid-19 began to have an impact on death statistics as the flu season came to an end, and recent data shows that 2020 is anything but a normal year.

Deaths from respiratory causes 

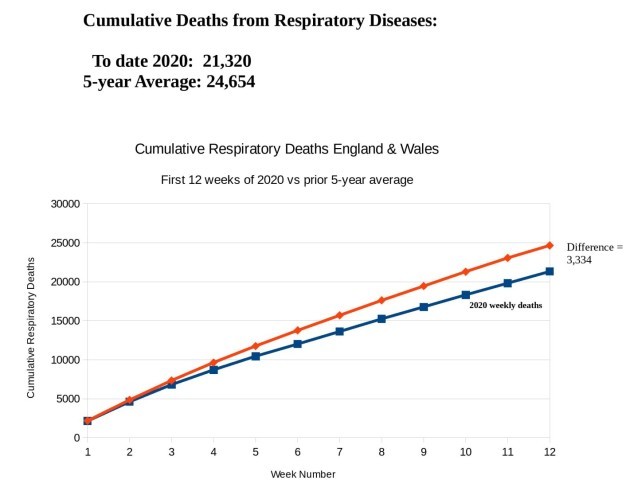
Meanwhile, a second graph shared on the blog (and subsequently on Facebook) suggests that the total number of deaths in England and Wales from respiratory diseases was below average during the first 12 weeks of the year.

It claims that there were 3,334 fewer deaths in the first 12 weeks of 2020, compared with the average number of deaths over the same period from 2015 to 2019. Here it is:

respiratory_deaths_chart_wks_1_to_12_r_watson_p2 Facebook Facebook

Once again, the data is sourced from ONS figures on deaths registered weekly in England and Wales.

A look at the data on the ONS website shows that the figures in the graph are inaccurate: the total number of deaths this year was actually 21,781 – not 21,320.

It’s a small difference, and the discrepancy may be down to the ONS updating its statistics in the weeks since the original graph was made.

Despite this, the 2020 figure was still almost 3,000 deaths below the five-year average from 2015 to 2019. But as we’ve already mentioned, a different picture emerged in weeks 13 and 14.

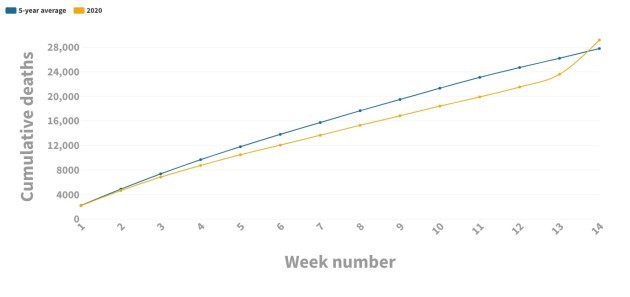
When data for these two weeks is included, the total number of deaths from respiratory causes in 2020 jumped to 31,246. That compares with an average of 27,444 deaths over the same period from 2015 to 2019.

Here’s what the graph above would look like with weeks 13 and 14 from this year were included:

snapshot-1587056110117 TheJournal.ie TheJournal.ie

As the graph shows, the number of cumulative deaths from respiratory illnesses in England and Wales is actually an increase on the average figure for the previous five years.

Therefore, the claim on Facebook that Covid-19 is not causing any more deaths in England and Wales than usual is not true.

Irish data

The claim on Facebook also suggested, somewhat vaguely, that statistics in Ireland show “the same thing” – that is, that the number of deaths here is not any higher than usual.

However, it is not currently possible to prove this claim one way or another.

Although the CSO does publish quarterly figures on the number of deaths in Ireland, data for the first quarter of 2020 has not yet been published.

Even when this data is released, statistics for January to March are not likely to show that Covid-19 had any major impact, as there were only 71 deaths from the virus up to 31 March.

Although it could be argued that the number of deaths back then was comparable to other years, health officials expected a surge in the number of deaths in the weeks that followed.

That’s why the government imposed bans on social gatherings, closed schools and childcare facilities, suggested people over 70 ‘cocooned’, urged people to work from home and introduced a range of other measures.

What’s more, there have been more than 500 new deaths attributed to the coronavirus since 1 April – the start of the second quarter.

For context, figures from the CSO show that respiratory diseases caused 979 deaths in the entire second quarter last year, as well as 1,040 deaths over the same period in 2018, and 923 deaths from April to June in 2017.

In three weeks, Covid-19 has killed around half the number of people as those who died from other respiratory illnesses in three months in previous years.

While the lack of official data means it is still not possible to say for definite, these statistics appear to show that this is not a normal year in Ireland.

EWNHc9pXsAI--Xf

**************************************

There is a lot of false news and scaremongering being spread in Ireland at the moment about coronavirus. Here are some practical ways for you to assess whether the messages that you’re seeing – especially on WhatsApp – are true or not. 

STOP, THINK AND CHECK 

Look at where it’s coming from. Is it someone you know? Do they have a source for the information (e.g. the HSE website) or are they just saying that the information comes from someone they know? A lot of the false news being spread right now is from people claiming that messages from ‘a friend’ of theirs. Have a look yourself – do a quick Google search and see if the information is being reported elsewhere. 

Secondly, get the whole story, not just a headline. A lot of these messages have got vague information (“all the doctors at this hospital are panicking”) and don’t mention specific details. This is often – but not always a sign – that it may not be accurate. 

Finally, see how you feel after reading it. A lot of these false messages are designed to make people feel panicked. They’re deliberately manipulating your feelings to make you more likely to share it. If you feel panicked after reading something, check it out and see if it really is true.

TheJournal.ie’s FactCheck is a signatory to the International Fact-Checking Network’s Code of Principles. You can read it here. For information on how FactCheck works, what the verdicts mean, and how you can take part, check out our Reader’s Guide here. You can read about the team of editors and reporters who work on the factchecks here

Have you gotten a message on WhatsApp or Facebook or Twitter about coronavirus that you’re not sure about and want us to check it out? Message or mail us and we’ll look into debunking it. WhatsApp: 085 221 4696 or Email: answers@thejournal.ie  

Your Voice
Readers Comments
72
This is YOUR comments community. Stay civil, stay constructive, stay on topic. Please familiarise yourself with our comments policy here before taking part.
Leave a Comment
    Submit a report
    Please help us understand how this comment violates our community guidelines.
    Thank you for the feedback
    Your feedback has been sent to our team for review.

    Leave a commentcancel