Advertisement

We need your help now

Support from readers like you keeps The Journal open.

You are visiting us because we have something you value. Independent, unbiased news that tells the truth. Advertising revenue goes some way to support our mission, but this year it has not been enough.

If you've seen value in our reporting, please contribute what you can, so we can continue to produce accurate and meaningful journalism. For everyone who needs it.
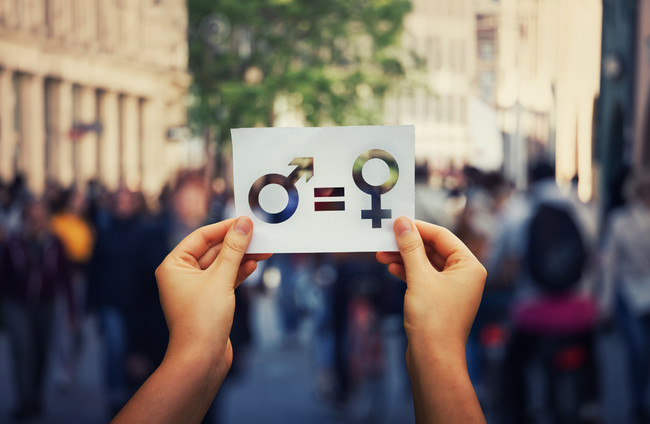
Shutterstock/StunningArt
Local Elections

Women represent less than 6% of seats on some councils - how does your council fare on gender?

Sinn Féin and Solidarity-People Before Profit were the only parties to see a decrease in the number of female elected candidates.

MORE THAN THREE-QUARTERS of candidates elected in last week’s local elections were male, with some councils seeing less than 6% of seats filled by female councillors. 

At general election level, political parties are required to have women make up 30% of their candidates, or lose half of the state-funding they receive. 

The challenge of achieving gender parity has been topical for a years now, with most political parties actively trying to increase their female candidates on ballot papers. 

In March, the now elected MEP Francis Fitzgerald chaired an event for women in politics at the Fine Gael National conference, which outlined the party’s aim to have over 30% of all elected Fine Gael councillors being women.

Fianna Fáil took a similar approach, hosting a ‘bootcamp training day’ ahead of the local elections. 

Much debate over whether a mandatory gender quota should be introduced has been heard inside and outside of Leinster House.

Gender gap

The local and European elections were opportunities for parties to increase the number of female candidates elected, and while many succeeded to do so, there still remains a huge gender gap on local councils.

While the coalition parties of Fine Gael and Fianna Fáil both increased their female representation on councils, Sinn Féin saw a drop in the number of elected women – due in part to a huge drop in seats won by the party overall.

Both the Labour Party and the Green Party also saw an increase in the number of female councillors elected in their parties compared to the 2014 elections.

The Solidarity-People Before Profit group was the only one not to have increased the proportion of elected party members who were female.

The Social Democrats launched in 2015 after the local elections in 2014 and so an accurate increase or decrease can’t be observed this time round.

Quotas

The fact that just a handful of councils saw female candidates fill more than 30% of the seats available has seen calls for enforcing gender quotas at all political levels – national and local.

Of the total 949 councillors elected across Ireland, just under 22% were women. 

The Women’s Council of Ireland said “it is very disappointing that in 2019, we still have not broken the critical mark of 30% women’s representation at local level”.

“While a record number of 566 women contested the elections, up from 440 in 2014, they only made up 29% of all of the candidates,” Orla O’Connor, Director of the National Women’s Council said.

“As was the case with the general elections, a gender quota for local elections is a necessity if we are serious about achieving gender equality,” she added.

Breakdown

Below is a breakdown of male to female councillors on each city and council in the country, ranked in order of best to worst when it comes to gender parity.

At the top of the list sits Dun Laoghaire Rathdown County Council who came closest as 48% of councillors elected were women.

On the other end of the scale Mayo County Council and Longford County Council both failed to give more than 7% of the total available seats to a female candidate.

Carlow County Council

  • Male: 16 councillors
  • Female: 2 councillors
  • Difference: 89% male / 11% female

Cavan County Council

  • Male: 12 councillors
  • Female: 6 councillors
  • Difference: 67% male / 33% female

Clare County Council

  • Male: 24 councillors
  • Female: 4 councillors
  • Difference: 86% male / 14% female

Cork County Council

  • Male: 40 councillors
  • Female: 15 councillors
  • Difference: 73% male / 27% female

Cork City Council

  • Male: 25 councillors
  • Female: 6 councillors
  • Difference: 81% male / 19% female

Donegal County Council

  • Male: 33 councillors
  • Female: 4 councillors
  • Difference: 89% male / 11% female

Dublin City Council

  • Male: 37 councillors
  • Female: 26 councillors
  • Difference: 59% male / 41% female

Dun Laoghaire-Rathdown County Council

  • Male: 21 councillors
  • Female: 19 councillors
  • Difference: 52% male / 48% female

Fingal County Council

  • Male: 29 councillors
  • Female: 11 councillors
  • Difference: 72% male / 28% female

Galway City Council

  • Male: 13 councillors
  • Female: 5 councillors
  • Difference: 72% male / 28% female

Galway County Council

  • Male: 32 councillors
  • Female: 7 councillors
  • Difference: 82% male / 18% female

Kerry County Council 

  • Male: 29
  • Female: 4
  • Difference: 88% male / 12% female

Kildare County Council

  • Male: 24 councillors
  • Female: 16 councillors
  • Difference: 60% male / 40% female

Kilkenny County Council

  • Male: 21
  • Female: 3
  • Difference: 87.5% male/ 12.5% female

Laois County Council

  • Male: 14 councillors
  • Female: 5 councillors
  • Difference: 74% male / 26% female

Leitrim County Council

  • Male: 15 councillors
  • Female: 3 councillors
  • Difference: 83% male / 17% female

Limerick City and County Council

  • Male: 32 councillors
  • Female: 8 councillors
  • Difference: 80% male / 20% female

Longford County Council

  • Male: 17 councillors
  • Female: 1 councillor
  • Difference: 94.5% male / 5.5% female

Louth County Council

  • Male: 20 councillors
  • Female: 9 councillors
  • Difference: 69% male / 31% female

Mayo County Council 

  • Male: 27 councillors
  • Female: 3 councillors
  • Difference: 93.4% male/6.6% female

Meath County Council

  • Male: 28 councillors
  • Female: 12 councillors
  • Difference: 70% male / 30% female

Monaghan County Council

  • Male: 15 councillors
  • Female: 3 councillors
  • Difference: 83% male / 17% female

Offaly County Council

  • Male: 17 councillors
  • Female: 2 councillors
  • Difference: 89.5% male / 10.5% female

Roscommon County Council

  • Male: 15 councillors
  • Female: 3 councillors
  • Difference: 83% male / 17% female

Sligo County Council

  • Male: 15 councillors
  • Female: 3 councillors
  • Difference: 83% male / 17% female

South Dublin County Council

  • Male: 27 councillors
  • Female: 13 councillors
  • Difference: 67% male / 33% female

Tipperary County Council

  • Male: 33 councillors
  • Female: 7 councillors
  • Difference: 82% male / 18% female

Waterford City and County Council

  • Male: 30 councillors
  • Female: 2 councillors
  • Difference: 83% male / 6% female

Westmeath County Council

  • Male: 16 councillors
  • Female: 4 councillors
  • Difference: 80% male / 20% female

Wexford County Council

  • Male: 28 councillors
  • Female: 6 councillors
  • Difference: 82% male / 18% female

Wicklow County Council

  • Male: 21 councillors
  • Female: 11 councillors
  • Difference: 66% male / 34% female

Your Voice
Readers Comments
94
This is YOUR comments community. Stay civil, stay constructive, stay on topic. Please familiarise yourself with our comments policy here before taking part.
Leave a Comment
    Submit a report
    Please help us understand how this comment violates our community guidelines.
    Thank you for the feedback
    Your feedback has been sent to our team for review.

    Leave a commentcancel