Sign in. It’s quick, free and it’s up to you.
An account is an optional way to support the work we do. Find out more.
Sign in. It’s quick, free and it’s up to you.
An account is an optional way to support the work we do. Find out more.

FROM OVER 30 indicators across eight areas of society, the Central Statistics Office (CSO) has published its Wellbeing of the Nation, a compilation of stats it says measures how people in Ireland feel about their lives.
While the country is undoubtedly wealthier now than it was in the depths of the recession, judging our society on that measure doesn’t really tell us how its people are getting on, the CSO said.
Just this week, two reports came out that provided starkly different perspectives on how Ireland is doing.
While Ibec hailed the end of the “recovery”, and said Ireland’s growing economy was now “more sustainable than the boom”, Social Justice Ireland said that almost 800,000 people are living in poverty.
Debt
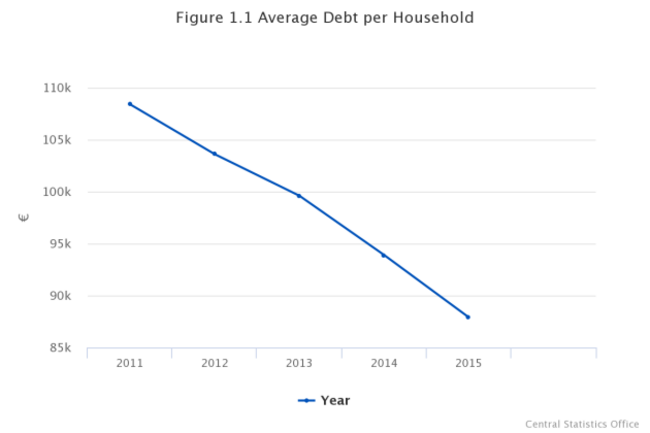
Some of the data used in the CSO report is more up to date than others, but the following representation of the average amount of debt per household, for example, shows a clear downward trajectory.
The average household debt was €108,400 in 2011. This fell to €103,600 in 2012, and continues to fall consistently year-on-year.
In 2015, the average household debt was €87,900.
Explaining why it used this measure, the CSO said: “High levels of debt can restrict a household’s access to some material goods and services, which can have a negative effect on wellbeing.
They can restrict access to services such as health and education, both of which are linked closely to wellbeing levels. High levels of debt can contribute to increased stress levels.
Combined with an increase in the average income per person, and a reduction in unemployment, Ireland seems to have definitely improved in these regards in recent years.
Not so good news
Describing the wellbeing of the nation as a whole, the current homeless crisis is represented by the CSO.
It highlights how the number of homeless people in Ireland almost doubled between the 2011 Census and the 2016 one.
The CSO said: “Having a home contributes greatly to individual wellbeing… It also provides people with a level of dignity and security that sleeping rough or being in emergency accomodation.”
Other indicators used are also a cause for concern.
Between 2004 and 2014, the number of adults who experienced discrimination in the workplace went up almost 10%.
In that year, half of all people over 18 said they’d experienced discrimination in the workplace.
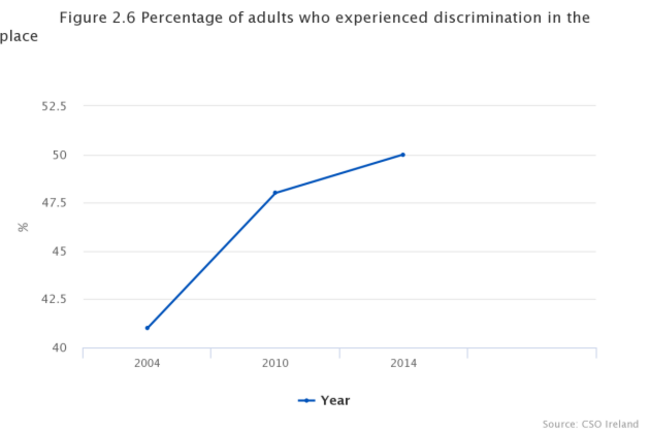
“High levels of discrimination in the workplace point to an unequal and unfair society,” the CSO said. “For the individual, discrimination can deeply affected their esteem, self-confidence and impinge on their human rights.
Including a measure of the existence of discrimination can provide an indication of the overall level of fairness in a workplace.
Another measure that is said to represent a fall for societal wellbeing is commuting time.
In the Census of 2011, people commuted for an average of 26.6 minutes, but this rose to 28.2 minutes in Census 2016.
The CSO said: “Commuting time can be seen as economically ‘inactive’ time, as it is neither leisure time nor work time. Increased commuting time can lead to higher levels of stress.”
A work in progress
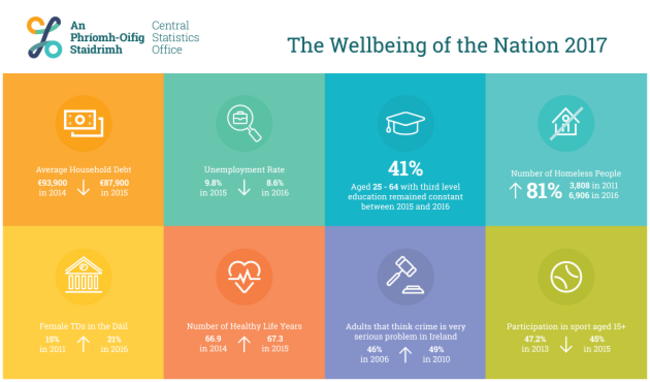
From other measures in the survey, participation in sport is down and obesity is up, but the average household spend on sport is up and more people are spending their time volunteering.
The consistent poverty rate is consistent (around 9% for 2013, 2014 and 2015), income distribution has become slightly more equal, and more people are staying in school until they finish their Leaving Cert.
The CSO added that the influences on wellbeing in Ireland are “many and complex” and that this first publication of the Wellbeing of the Nation is an attempt to provide some substantive indicators of how we’re all getting on.
It said: “The release of wellbeing data is a new initiative for the CSO, and will be developed in the future.”
Work is also underway on an “interactive dashboard” that will “provide the public with an intuitive and easy-accessible source for well-being data and will be developed in 2018″.

To embed this post, copy the code below on your site














have your say