Advertisement

We need your help now

Support from readers like you keeps The Journal open.

You are visiting us because we have something you value. Independent, unbiased news that tells the truth. Advertising revenue goes some way to support our mission, but this year it has not been enough.

If you've seen value in our reporting, please contribute what you can, so we can continue to produce accurate and meaningful journalism. For everyone who needs it.

ralph and jenny via Flickr/Creative Commons
Growth

The slowest-growing cities of the past 20 years

Some cities have found it more difficult than others to recover from the 2008 economic meltdown…

SOME CITIES STILL haven’t recovered from the 2008 economic meltdown. And others have been suffering for decades.

New data in Brookings’ 2012 Global MetroMonitor allows us to rank 300 major metro areas by change in GDP per capita and employment from 1993 to 2012.

The best cities for economic growth are mostly in emerging markets, particularly China.

The worst cities are found in Japan, the US, and Europe…

34. Chicago, USA

  • 1.3 per cent real GDP per capita annualised change from 1993 to 2012
  • 0.4 per cent employment annualised change from 1993 to 2012

Chicago has had a pretty painful year — it just experienced its most violent summer in recent memory and the teacher’s union strike in September paralyzed schools as they prepared to open. Chicago’s crime rates have been on the rise for years, and it has gained the title of “America’s most dangerous city.”

33. Milwaukee, USA

  • 1.3 per cent real GDP per capita annualised change from 1993 to 2012
  • 0.3 per cent employment annualised change from 1993 to 2012

Milwaukee and the entire Great Lakes region has been hit hard by the recession. Breweries have been some of the biggest employers in the city, but today Miller Brewing Company is the only major brewing company left. Pabst Brewery closed its complex in Milwaukee in 1997, and the other two famous brewers that used to occupy Milwaukee — the Valentin Blatz Brewing Company and the Joseph Schlitz Brewing Company — were both sold to Pabst.

32. Köln-Düsseldorf, Germany

  • 1.0 per cent real GDP per capita annualised change from 1993 to 2012
  • 0.5 per cent employment annualised change from 1993 to 2012

31. New Haven, Connecticut, USA

  • 1.2 per cent real GDP per capita annualised change from 1993 to 2012
  • 0.3 per cent employment annualised change from 1993 to 2012

New Haven has been withering since the end of World War II. After the war, the manufacturing industry, which had driven the local economy, began to decline. Consequently, the middle class began to leave the city in the 1950s, and crime rates have been on the rise since the 1960s.

20. Cleveland, USA

  • 1.3 per cent real GDP per capita annualised change from 1993 to 2012
  • -0.1 per cent employment annualised change from 1993 to 2012

The auto industry’s collapse reverberated all the way to Cleveland. The 2008 recession hit all of Ohio hard, costing the state over 100,000 jobs according to some estimates.

29. Hannover, Germany

  • 0.99 per cent real GDP per capita annualised change from 1993 to 2012
  • 0.5 per cent employment annualised change from 1993 to 2012

Although Hannover is home to the second largest Oktoberfest in the world, the party doesn’t go year-round. Hannover has struggled to recover since World War II, when over 90 percent of the city center was destroyed. Volkswagen Commercial Vehicles has its headquarters in Hannover today, but it has reportedly been exploring moving some of its operations to China.

28. Stuttgart, Germany

  • 1.0 per cent real GDP per capita annualised change from 1993 to 2012
  • 0.5 per cent employment annualised change from 1993 to 2012

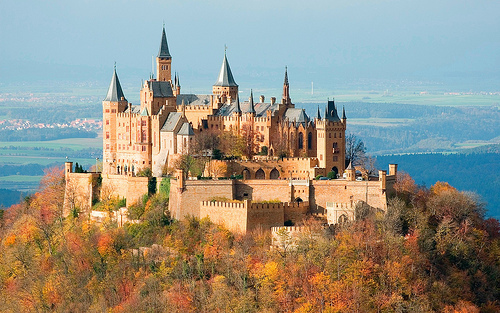
Stuttgart is known as the “cradle of the automobile,” as it was invented and industrialized in the area.  While its RND sector is quite strong, the decline of the auto industry in the last decade has affected its economy.

Image: Trodel via Flickr

27. Birmingham, Alabama

  • 1.1 per cent real GDP per capita annualized change from 1993 to 2012
  • 0.4 per cent employment annualized change from 1993 to 2012

Although Birmingham’s economy has been well for most of the last twenty years, recent events have thrown it into flux. Last year, Jefferson County, which includes Birmingham, filed for what was at the time the largest US municipal bankruptcy claim after losing over $3 billion in sewer debt.

26. Verona, Italy

  • 0.1 per cent real GDP per capita annualised change from 1993 to 2012
  • 0.7 per cent employment annualised change from 1993 to 2012

25. Kumamoto, Japan

  • 1.2 per cent real GDP per capita annualised change from 1993 to 2012
  • 0.1 per cent employment annualised change from 1993 to 2012

Ten Japanese cities made the list, as the country suffered two “lost decades” following its economic boom in the eighties.

24. Milan, Italy

  • 0.1 per cent real GDP per capita annualised change from 1993 to 2012
  • 0.7 per cent employment annualised change from 1993 to 2012

Milan, like the rest of Italy, has been hit hard by the Eurozone Crisis. It doesn’t help that its population has been on the decline for the last twenty years.

23. Bielefeld-Detmold, Germany

  • 0.6 per cent real GDP per capita annualised change from 1993 to 2012
  • 0.5 per cent employment annualised change from 1993 to 2012

22. Basel-Mulhouse, Switzerland

  • 0.7 per cent real GDP per capita annualised change from 1993 to 2012
  • 0.4 per cent employment annualised change from 1993 to 2012

21. New Orleans, USA

  • 1.1 per cent real GDP per capita annualised  change from 1993 to 2012
  • -0.3 per cent employment annualised change from 1993 to 2012

Although New Orleans may be one of the fastest growing cities in the United States, Hurricane Katrina and the Deepwater Horizon spill made the effects of the 2008 recession much worse. The spill devastated the fishing industry, among others, just after an already painful recover from Hurricane Katrina.

A great deal of commercial traffic which used to move by boat out of New Orleans’ port is now moved by truck, air, and rail instead.

20. Nagoya, Japan (tie)

  • 1.1 per cent real GDP per capita annualised change from 1993 to 2012
  • 0 per cent employment annualised change from 1993 to 2012

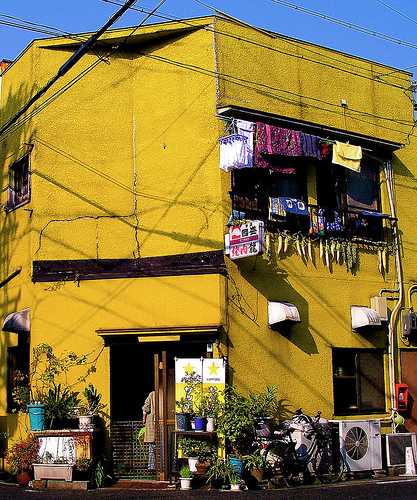
Image: isado via Flickr

20. Turin, Italy (tie)

  • 0.2 per cent real GDP per capita annualised change from 1993 to 2012
  • 0.6 per cent employment annualised change from 1993 to 2012

All three cities that make up Italy’s ”industrial triangle” — Turin, Milan, and Genoa — made the list. Turin is also the unofficial capitol of Italy’s automotive industry, which has suffered serious setbacks in production since the recession began. Its population, like that of Milan, is also on the decline since 1990.

18. Bologna, Italy

  • 0.3 per cent real GDP per capita annualised change from 1993 to 2012
  • 0.5 per cent employment annualised change from 1993 to 2012

17. Lisbon, Portugal (tie)

  • 1.0 per cent real GDP per capita annualized change from 1993 to 2012
  • 0.2 per cent employment annualized change from 1993 to 2012

During Lisbon’s early history, the economy was based on the fishing industry. Today, finance and service have become important sectors as well. Many were optimistic about the future economic prospects in Lisbon before the sovereign debt crisis, but the crisis and corresponding austerity measures have stifled its economy.

17. Berlin, Germany (tie)

  • 0.6 per cent real GDP per capita annualised change from 1993 to 2012
  • 0.5 per cent employment annualised change from 1993 to 2012

Berlin’s manufacturing and financial sectors suffered because of its division during the Cold War. And although Berlin has suffered comparatively less than its European counterparts, it is still one of the poorest areas in Germany — more people in Berlin are living of government welfare than anywhere else in the country (by percentage).

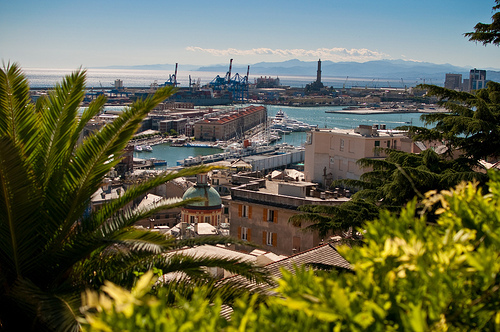
15. Genoa, Italy

  • 0.8 per cent real GDP per capita annualized change from 1993 to 2012
  • 0.4 per cent employment annualized change from 1993 to 2012

Image: dane brian via Flickr

14. Okayama, Japan

  • 1.1 per cent real GDP per capita annualised change from 1993 to 2012
  • -0.3 per cent employment annualised change from 1993 to 2012

13. Kitakyushu-Fukuoka, Japan

  • 0.9 per cent real GDP per capita annualised change from 1993 to 2012
  • 0.1 per cent employment annualised change from 1993 to 2012

12. Florence, Italy

  • 0.4 per cent real GDP per capita annualised change from 1993 to 2012
  • 0.4 per cent employment annualised change from 1993 to 2012

Like the other Italian cities on this list, Florence has been crushed by the sovereign debt crisis and the political turmoil of the Berlusconi government. To make matters worse, Italy’s unemployment rate just hit a record 11.1 percent.

11. Tokyo, Japan

  • 0.5 per cent real GDP per capita annualised change from 1993 to 2012
  • 0.3 per cent employment annualised change from 1993 to 2012

Although Tokyo still has one of the largest economies in the world, the Japanese economic boom ended in the eighties. The country faced a deep recession in the late nineties, and has struggled to recover from the current global economic crisis. Meanwhile the cost of living has become one of the highest in the world.

10. Hiroshima, Japan

  • 0.94 per cent real GDP per capita annualised change from 1993 to 2012
  • -0.4 per cent employment annualised change from 1993 to 2012

9. Dayton, Ohio

  • 0.935 per cent real GDP per capita annualized change from 1993 to 2012
  • -0.4 per cent employment annualized change from 1993 to 2012

Dayton’s economy has traditionally been driven by its manufacturing sector. Although it has diversified by introducing strong defense, aerospace, and healthcare industries, the decline in heavy manufacturing has stymied the local economy. The recession and corresponding defense cuts have deepened the wounds.

8. Honolulu, Hawaii, USA

  • 0.2 per cent real GDP per capita annualised change from 1993 to 2012
  • 0.2 per cent employment annualised change from 1993 to 2012

Image: Fizzcity Gallery via Flickr

7. Porto, Portugal

  • 0.5 per cent real GDP per capita annualised change from 1993 to 2012
  • -0.2 per cent employment annualised change from 1993 to 2012

6. Niigata, Japan

  • 0.7 per cent real GDP per capita annualised change from 1993 to 2012
  • -0.6 per cent employment annualised change from 1993 to 2012

5. Naples, Italy

  • 0.2 per cent real GDP per capita annualised change from 1993 to 2012
  • -0.1 per cent employment annualised change from 1993 to 2012

4. Osaka-Kobe, Japan (tie)

  • 0.5 per cent real GDP per capita annualized change from 1993 to 2012
  • -0.3 per cent employment annualized change from 1993 to 2012

3. Detroit (tie)

  • 0.5 per cent real GDP per capita annualised change from 1993 to 2012
  • -0.3 per cent employment annualised change from 1993 to 2012

Not surprisingly, Detroit tops the US cities that have suffered the most in the last twenty years. The auto industry’s decline and recent near-collapse led to tons of lost jobs. In fact the city lost a quarter of its population in the first decade of the new century.

2. Sapporo, Japan

  • 0.1 per cent real GDP per capita annualised change from 1993 to 2012
  • -0.3 per cent employment annualised change from 1993 to 2012

The city, known for the eponymous beer company, has also bore the brunt of much of the recession. Although the city has developed a thriving IT sector, it also relies on manufacturing for much of its income — an industry that has been seriously affected by Japan’s decline.

1. Sendai, Japan

  • 0.0 per cent real GDP per capita annualised change from 1993 to 2012
  • -0.6 per cent employment annualised change from 1993 to 2012

Sendai was already affected by Japan’s economic downturn, but the 2011 tsunami made things much worse. Overall, the tsunami destroyed five to six percent of GDP in all of Japan, according to some estimates. The World Bank pegged the entire cost at $235 billion.


Cities are ranked according to Brookings data. Rankings were derived by combining real GDP per capita annualised growth rank and employment annualised growth rank.

This article was reproduced with permission from Business Insider

Published with permission from
Business Insider
Your Voice
Readers Comments
12
    Submit a report
    Please help us understand how this comment violates our community guidelines.
    Thank you for the feedback
    Your feedback has been sent to our team for review.