Advertisement
Cigarette related litter makes up over a half of all littering. PA Images
kick the habit

Littering could literally be halved if cigarette butts weren't thrown on the ground

The 2018 National Litter Pollution Monitoring System Report has highlighted the extent of the problem

CIGARETTE BUTTS BEING left on the ground makes up over half of all instances of littering in the country.

The 2018 National Litter Pollution Monitoring System Report shows that cigarette items make up 54.4% of all litter.

The report details that cigarettes stubbornly remain the most frequent form of littering, almost three times more common than the second-most frequent type, packaging items (at 18.2%).

“Littering could be halved if cigarette butts were properly disposed of,” Environment Minister Richard Bruton said upon publication of the report.

We seem to have a blind spot for this behaviour – it is six times more prevalent than sweet papers.

The minister went on to commend the “vigorous efforts” of volunteer community groups and local authorities who have led to some “promising results” in the survey compared to last year.

This year’s report found that 20.5% of the areas surveyed were described as “unpolluted or litter free”, an increase of 4.9 percentage points compared to 2017, while 59.6% were found to be slightly polluted, a decrease of 4.3 percentage points on 2017.

In terms of the cause of littering, passing pedestrians continue to be the single largest cause, followed by motorists and then retail outlets.

The report shows that the top constituents of litter pollution are:

  • Cigarette related litter (54.4%)
  • Packaging items (18.2%)
  • Sweet related litter (9.2%)
  • Food related litter (8.9%)
  • Paper items (5.8%)

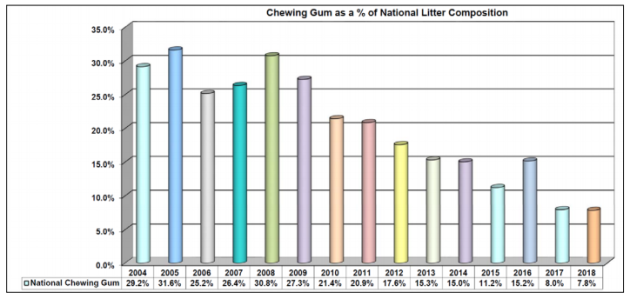
Within the food-related litter category, chewing gum is the single largest component and makes up 7.8% of all litter nationally.

This has, however, halved since 2016 and decreased from a high of 31.6% in 2005.

PastedImage-25884 dccae.gov.ie dccae.gov.ie

The main causes of litter were identified as:

  • Passing pedestrians (42%)
  • Passing motorists (22.4)
  • Retail outlets (9.4%)
  • Gathering points (6%)
  • Places of leisure and entertainment (4.7%)
  • Fast food outlets (3.9%)
  • Schools/school children (3.5%)
  • Bus stops (2.6%)
  • Fly-tipping (2.2%)

Your Voice
Readers Comments
72
This is YOUR comments community. Stay civil, stay constructive, stay on topic. Please familiarise yourself with our comments policy here before taking part.
Leave a Comment
    Submit a report
    Please help us understand how this comment violates our community guidelines.
    Thank you for the feedback
    Your feedback has been sent to our team for review.

    Leave a commentcancel