Sign in. It’s quick, free and it’s up to you.
An account is an optional way to support the work we do. Find out more.
Sign in. It’s quick, free and it’s up to you.
An account is an optional way to support the work we do. Find out more.

The Housing Essay is a weekly deep dive from a rotating variety of voices into issues impacting the property crisis in Ireland. Are there potential solutions that may be currently overlooked or traditionally ignored by policymakers?
INTERNATIONALLY, HOUSING CRISES are not that unusual, particularly at present, but in Ireland they have been almost continuous, from the late 1970s onwards. These have been prompted mainly by the Irish economic cycle, which shows no signs of weakening. Until this is more fully recognised, it is likely to disrupt current and future policies as effectively as past ones.
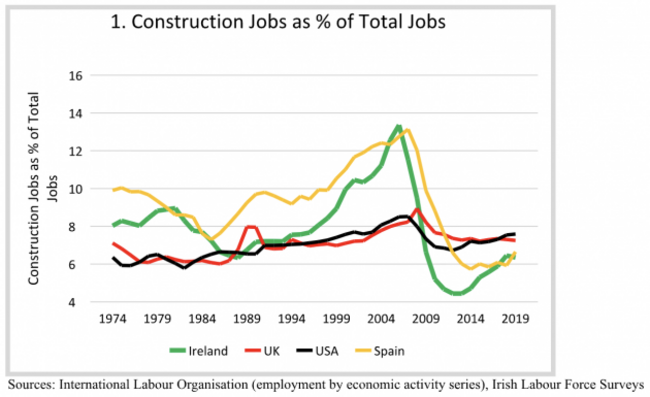
Supply and demand for housing in Ireland are both highly cyclical, but do not vary in tandem. Supply of housing influences and reflects the size of construction industries, which can be quantified as employment in them as a percentage of overall employment. This percentage has varied far more in Ireland than in, say, Britain or the United States. Of the dozen other countries analysed, Spain and Portugal were highly cyclical like Ireland; the other ten largely conformed to the Anglo-American pattern.
Demand for housing reflects growth in the number of households, which is in turn strongly influenced by employment growth. But Ireland is also an outlier in the latter respect. Ireland, Spain and Portugal had very much the most variable employment growth rates.
Long construction lead times mean there is a need to see ahead. Builders may complete houses three to four years after lodging a planning application and five to six years after acquiring the site, and infrastructure providers may have projects ready for use seven to ten years after starting the design process. They need some idea of how much housing will be needed that far ahead.
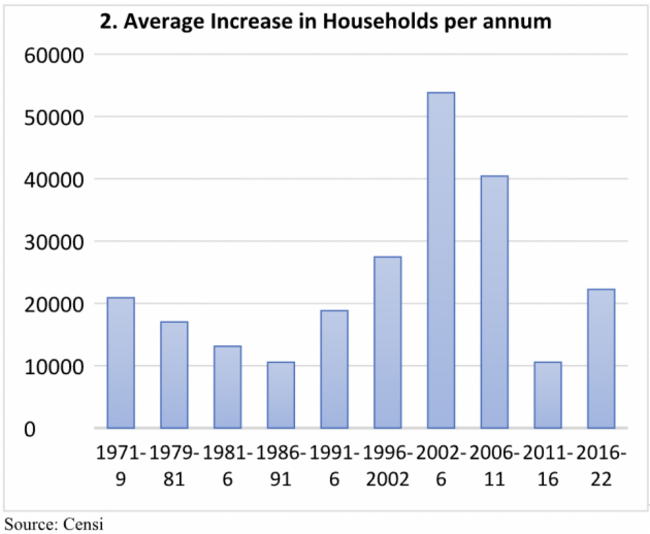
Chart 2 shows how unpredictable household growth has been. Any policy maker, developer or infrastructure provider who assumed the next intercensal period would be similar to the last one would have been wrong on every single occasion since 1979. The nearest we came to predictability was in the 1980s, when household growth halved in three roughly equal steps.
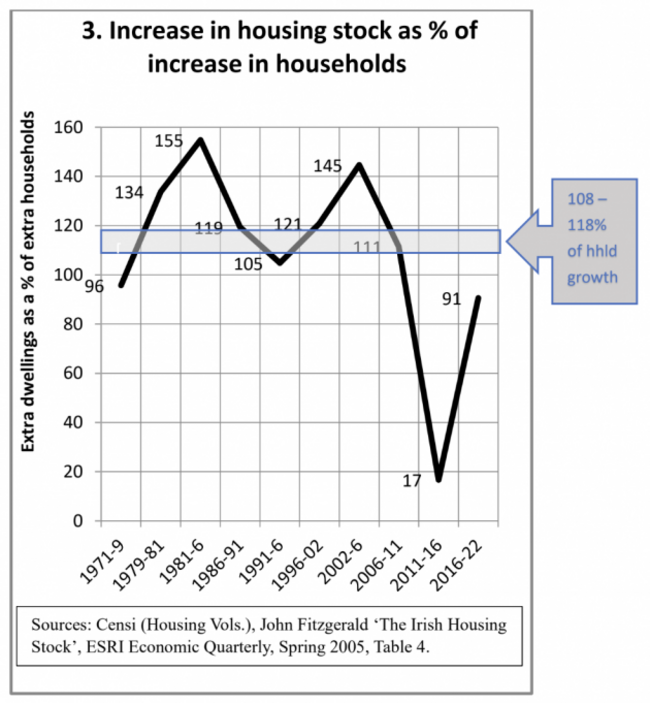
If these supply and demand-related factors are combined, a fairly chaotic picture emerges. Successive censuses have shown that, in addition to the stock of occupied houses in the State, there are 8-18% unoccupied but habitable ones, depending on the year. This range could be used for planning purposes (ie, increase the housing stock by 8-18% more than the anticipated increase in households). Many would feel this range is too wide, but actual variation has been far greater, as Chart 3 shows:
Output kept passing through the 108-118% band, in an upward or downward direction, but didn’t stay within it. The only exception was 2006-11, when the percentage (111%) was en route from 145% of household growth in 2002-6 to 17% in 2011-16. The disconnect between supply and demand more or less guarantees the wrong amount of housing will be provided.
The cycle works this way due to time lags. It can be broken down into four phases:
1. Recession and early recovery: In a recession, there is typically an oversupply of housing. At some point, demand starts to recover, and there is a switch from oversupply to undersupply (e.g. after 1991 and 2011). However, surpluses built up in the previous recession mean there is a time lag before undersupply affects prices and rents.
2. Late recovery/early boom: In this phase, the effect of undersupply on prices becomes obvious (e.g. from 1996, 2015), but there is an interval before builders can plan, construct and market the extra units needed, during which prices surge, while output responds more gradually. Typically, this coincides with a sharp rise in incomes, reinforcing the price surge.
3. Late boom: If and when output responds fully to the high prices established in (2), there is another switch, from undersupply to oversupply (e.g. after 1979, 2002). In the time lag before this becomes apparent, prices continue to rise.
4. Downturn: External events damage confidence and reduce sales. Oversupply and unsustainably high prices then become obvious, and a reduction or collapse in output and prices results.
Typically, price surges in phase 2 destabilise the system, and stimulate oversupply in phase 3, leading to an unnecessarily severe downturn in phase 4. In phase 1 of the next cycle, the state cannot or does not adequately repair the damage done by the previous one or prepare sufficiently for a future recovery. It then responds to the phase 2 price surge which follows with catch-up policies.
In future, we need to pay close attention to switches from undersupply to oversupply or vice versa. In 2002 and 2011, signals from the Census were in conflict with the prevailing view, but in line with what was about to happen. Such signals won’t tell us how many houses to build, but if supply and demand are conceived as runners in a two-horse race, they may show which one is edging ahead, and when stimulus or restraint might help keep them in line.
Different approaches are appropriate in different phases. We are currently trapped in phase 2 by failure or inability to read the cycle in previous phases, and make appropriate advance preparations and contingency plans. Escape will not be easy. Loss of house-building and financial capacity at the end of the previous cycle, and reduced investment in housing-related infrastructure, haven’t yet been adequately repaired. If and when they are, and a rough balance between supply and demand is achieved, this may not prevent continuing increases in prices and rents.
In the previous cycle, balance had been achieved by 2002, but even with large scale over-supply in the 2002-6 period, real house prices rose by an average of 11% per annum. They collapsed in 2008, but only after a characteristic time lag. In the absence of over-supply, continuing price rises would be even more likely, and price stabilisation or collapse less so.
Developers are particularly inclined to concentrate output at the upper end of the market in phase 2, where margins are unusually high. In previous cycles, governments tried to change the output mix, so more units are available to lower income groups, but in this one, they have done the reverse and promoted high-cost apartments most, though with the effects diluted by large subsidies and extensive state purchases.
In a recent housing essay on The Journal, I drew attention to the potential of two-bedroom houses. They would cost 20-30% less to build than apartments of the same size, and need not cause any reduction in average densities. Few are built at present. Requiring 20-25% of units in developments which contained both apartments and houses to be two-bedroom terrace houses would change the mix. The price of the standard semi would still rise, but a wider range of units costing much less would be available.
Social housing is a classic victim of the cycle. In two successive cycles, it peaked in phase 3, at 7,000 units in 1984 and 6,800 in 2008 – the points at which previously unacknowledged over-supply became obvious. This made it a sitting duck for cutbacks, to 800 (by 1989) and 500 (by 2013). Recovery was too slow to have much effect in phase 2 of the following cycle, when it would be of most value: local authority output was 1,600 units in 2025. The (national) Land Development Agency was launched in 2018, but it takes time for new initiatives to deliver. It reached 890 units by 2024, but has ambitious targets (e.g. 3,500 by 2028).
Most new social housing is currently built by private sector developers and then sold to state-funded organisations. If it was developed mainly by public bodies, using contractors, more social units could be provided, as contracting is lower risk and easier to finance than speculative development. Also, more developer-built units would be available for sale on the open market.
We need more contractor built social housing, larger local authority teams to design them, and greater vigilance than in the past, to detect any indications of emerging oversupply.
Policies to manage the overall cycle don’t fit snugly into any interest group or institutional agenda, or ideological narrative, or professional comfort zone, so they don’t have natural supporters. But they are needed. Perhaps, eventually, this will be recognised.
Dr Nicholas Mansergh MIPI was a Senior Planner with Cork County Council until his retirement in 2015. He is the author of The Irish Construction Cycle 1970-2023: policies and escape routes (Eastwood Books, 2024).
To embed this post, copy the code below on your site














have your say