Sign in. It’s quick, free and it’s up to you.
An account is an optional way to support the work we do. Find out more.
Sign in. It’s quick, free and it’s up to you.
An account is an optional way to support the work we do. Find out more.
WATER CHARGES IN Ireland have been a huge source of controversy for over two years now.
The charges and the establishment of governing body Irish Water were a black cloud that seemed to follow the last government around no matter where it went.
In the aftermath of the last election the charges were officially suspended and an expert commission on water was established (which in less than a week managed to shed its chairman Joe O’Toole).
The charges are a thorny subject whatever way you look at it. But examining the figures shows that the charges Irish people (specifically those in the Dublin area) were until recently paying (in theory at least) weren’t particularly high by European standards.
Click here to view a larger image
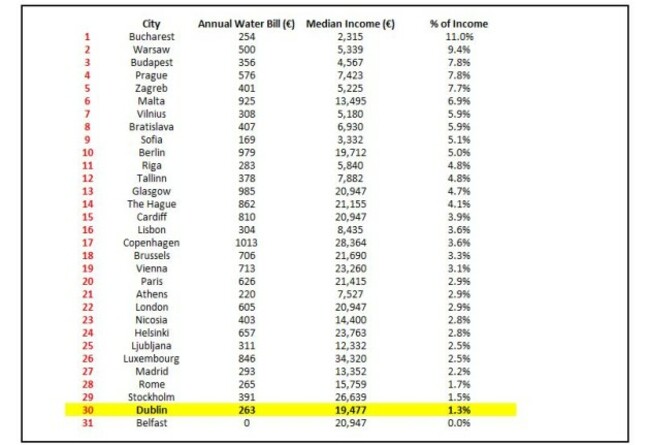
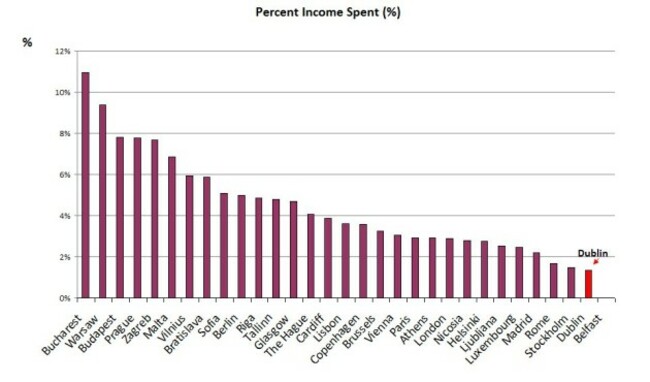
In fact, if you take the charges applicable in 31 European cities and take them as a percentage of average income in that country, Dublin, and by proxy Ireland, ranks the lowest out of all 31 with just 1.3% of median income spent on charges.
The figures are a rough approximation given the charges information given relates to cities, and not countries, but a relatively informative set of data is nevertheless presented.
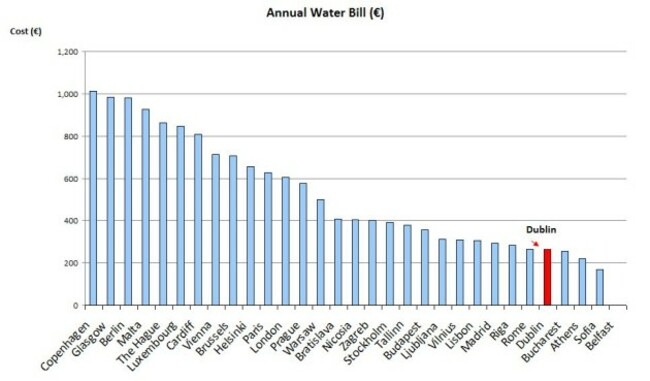
Looking at the charges themselves, those seen in Dublin (and again by proxy Ireland) are the fifth lowest seen in the 31 European cities surveyed at €263 annually (Sofia, Bulgaria, has the lowest at €169 yearly).
Click here to view a larger image
Copenhagen, Glasgow, and Berlin have the most expensive charges seen across the 31 cities surveyed with annual charges of €1,013, €985, and €972 respectively.
However, given the average income seen in these cities is much higher than in other European countries, their ranking on the percentage scale of income spent on charges is not quite so high – with Berlin ranking highest of the three at number 10 out of 31.
Click here to view a larger image
The city statistics come from the July 2016 Global Water Tariff Survey as published by Global Water Intelligence (apart from those of Malta, which are published nationally in that country), which compares the amount charged for water in cities across the globe per cubic metre.
Income statistics meanwhile are taken from Eurostat, the European statistics body (most income data is from 2015, with some, including that of Dublin itself, representing 2014 figures).

To embed this post, copy the code below on your site











have your say