Sign in. It’s quick, free and it’s up to you.
An account is an optional way to support the work we do. Find out more.
Sign in. It’s quick, free and it’s up to you.
An account is an optional way to support the work we do. Find out more.
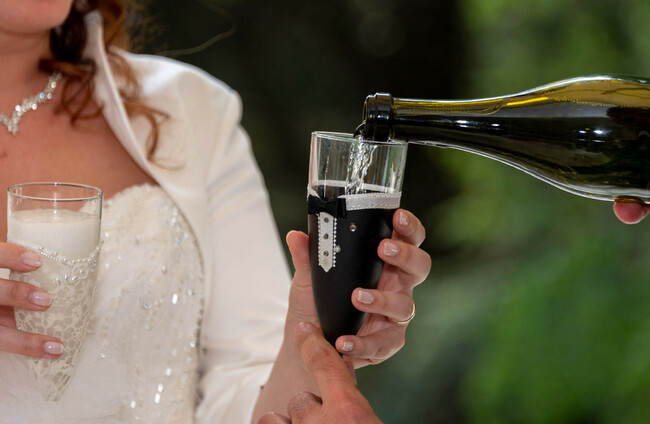
THE MOST POPULAR days to get married in Ireland have been revealed.
So do they finally put the age-old summer versus Christmas wedding debate to bed?
Well, no – not really.
Research from the Central Statistics Office (CSO) drilled into the data from all weddings between 2011 and 2024 and gave details on the most popular days and months for getting married.
Wedding fireworks trumped the cold as New Year’s Eve came out as the most popular day for weddings with 189 marriages on average each year.
The week between Christmas and New Year’s claimed the next few top spots, with 30 December in second, 28 December in third and 29 December in fourth.
Lovers of the summer months were represented in the top ten with 3 August, 4 and 5 making up the fifth, sixth and seventh most popular days to get married respectively.
Unsurprisingly, the least popular day to get married in the 14-year period was Christmas Day with zero weddings recorded.
This was followed by 26 December, with three marriages a year, and 24 December, with four marriages a year.
The day before St Patrick’s Day proved popular, with an average of 90 weddings recorded per year, making it by far the most popular day to get married in the first five months of the year.
While December dates topped the individual days list, it was only the sixth most popular month to get married.
The top spot on the most-popular-month list went to August, which sees an average of 2,733 weddings per year.
Irish people are fond of a summer wedding with warmer months July (2,446) and September (2,333) claiming second and third on that list.
January and February were the least popular months for weddings with and average of just 612 and 803 marriages recorded per year.
There were 20,348 marriages registered in Ireland in 2024, the last year covered in this particular study. The average age of those tying the knot that year was 35.9 years for women and 37.7 years for men.
In 2024 the most popular day of the week to wed was Friday, while the least was Tuesday.
Those curious to see where their wedding date ranked in the list can search it on the CSO website.
Which do you prefer attending as a guest?
To embed this post, copy the code below on your site













have your say