Advertisement

We need your help now

Support from readers like you keeps The Journal open.

You are visiting us because we have something you value. Independent, unbiased news that tells the truth. Advertising revenue goes some way to support our mission, but this year it has not been enough.

If you've seen value in our reporting, please contribute what you can, so we can continue to produce accurate and meaningful journalism. For everyone who needs it.

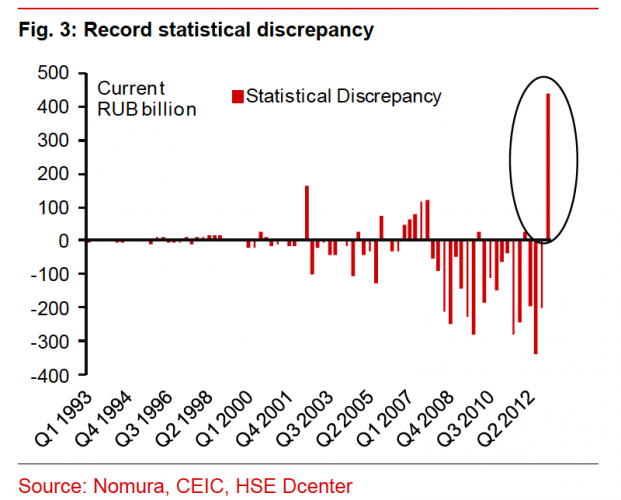
statistical discrepancy

This graph shows that data on Russia's economy could be very inaccurate

The statistical discrepancy of the figures is at an all-time high, and economists are worried.

CHINESE ECONOMIC DATA is often branded as being heavily manipulated and hopelessly unreliable, though for the most part those concerns are overblown. Chinese numbers tend to be directionally correct, even if they may be imprecise.

However, if you’re looking for suspect data, check out the situation in Russia.

Russia is going through the same economic turmoil as its fellow BRICs (a group of emerging economies in a similar situation, Brazil, Russia, India, China, and South Africa). It’s massive growth before and right after the global economic crisis allowed the country to ignore structural issues that are now proving to be problematic.

But economists are alarmed at the unreliability of the data.

Poor quality official data

Last month, Nomura strategists Olgay Buyukkayali and Dmitri Petrov kicked off a multi-volume report on Russia’s weakening economy by noting how poor the official data quality is.

They refer to statistical discrepancy, which is the difference between a country’s Gross Domestic Income (GDI, or the sum of all income earned while producing goods and services within a country) and Gross Domestic Product (GDP, or the sum of all goods and services produced in a country).

In theory, both GDP and GDI should be the same, but in practice they are not due to human error, and so the figures must be adjusted slightly.

The errors puzzle in the breakdown

Russian growth contains some puzzles. The first is in the expenditures contribution. Quarter 1 (Q1) growth was 1.6% year-on-year, and statistical discrepancy contributed up to 1.8% on the upside. At this stage the official breakdown of Q2 GDP contributions is not yet available. However, this is not an issue as last quarter’s Rosstat GDP data asked more questions than it answered. If one adds up the contributions of the expenditure components to Q1 GDP, the resulting figure of 0.6% is noticeably lower than 1.6% headline growth. For statistical reasons, the discrepancy is not unusual, but in this particular case it seems that Rosstat cannot figure out where the growth is coming from.

First, the statistical discrepancy is at its historically highest level. Second, despite overall stagnation, household consumption accelerated from 5.8% in Q4 to 6.1% in Q1, although this time with weaker retail sales growth, which intuitively as well as statistically is quite unusual. This creates uncertainty around the official composition of Q1 growth which will hopefully be revised when the Q2 breakdown is released. This could lead to the Q1 and Q2 consumption picture being reassessed (in our view, lower).

Here’s the chart showing a massive statistical discrepancy in Q1.

image

You can view a larger version of the graph here. (Image Credit: Nomura)

- Joe Weisenthal

Read: China’s economy is booming, but here’s what could go wrong >

More: Police seize painting of Russian President and PM ‘in women’s underwear’ >

Published with permission from
Business Insider
Your Voice
Readers Comments
21
    Submit a report
    Please help us understand how this comment violates our community guidelines.
    Thank you for the feedback
    Your feedback has been sent to our team for review.