Advertisement

We need your help now

Support from readers like you keeps The Journal open.

You are visiting us because we have something you value. Independent, unbiased news that tells the truth. Advertising revenue goes some way to support our mission, but this year it has not been enough.

If you've seen value in our reporting, please contribute what you can, so we can continue to produce accurate and meaningful journalism. For everyone who needs it.

FACTCHECK

Debunk: No, these maps don't show large areas of Irish cities that 'could be underwater’ by 2050

While the ‘stark images’ are alarming, they depict something else.

download

MAPS PROJECTING THE effects of climate change on sea levels do not show that large areas of major Irish cities could be underwater by 2050 – even though these areas will likely be more affected by flooding more often by that point.

A series of interactive web maps released by Climate Central, a US-based non-profit organisation that researches and analyses climate science, have often been misinterpreted or presented out of context.

The maps have regularly been described as showing areas that will be “underwater” by a certain date, often by well-meaning people wishing to highlight the real danger of climate change. Such maps have featured multiple times in the English press.

More recently, these maps have been used in an article from the Irish Daily Mirror that appears on Facebook with the headline: “Parts of Ireland that could be underwater by 2050 with major cities in danger”.

The same publication published a similar article last year, with the headline: “Map shows how much of Ireland could be under water by 2050 – with five counties in trouble”.

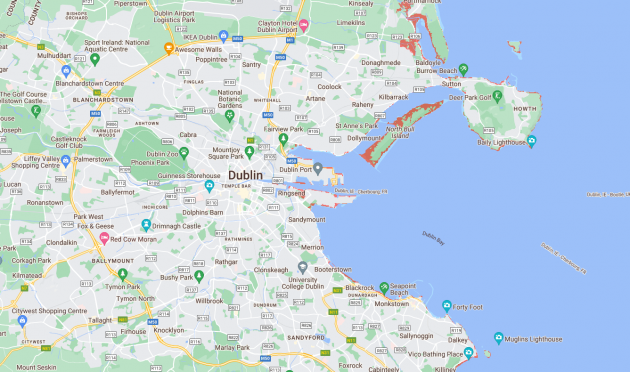
These articles show a series of — as the paper puts it — “very stark images”: One of Dublin shows the Howth penninsula cut off from the rest of the county, while Bull Island, East Wall and Sandymount are almost completely covered by overlaid thick strips of red.

Dublin below annual flood level by 2050 Via: Climate Central

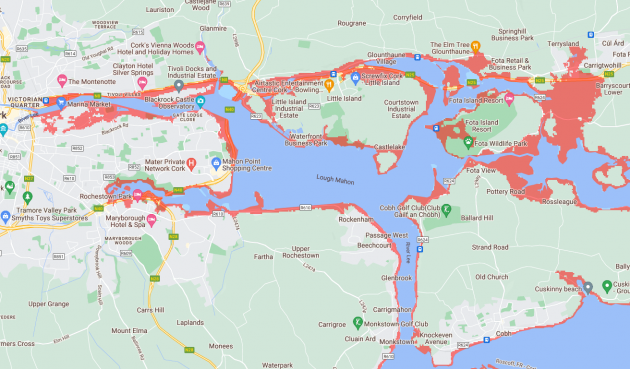
Another shows Cork city centre near the River Lee marked in red, Youghal being surrounded, and Fota Island and Little Island being cut off from the rest of a county by wide, red stretches.

Cork below annual flood 2050 Via: Climate Central

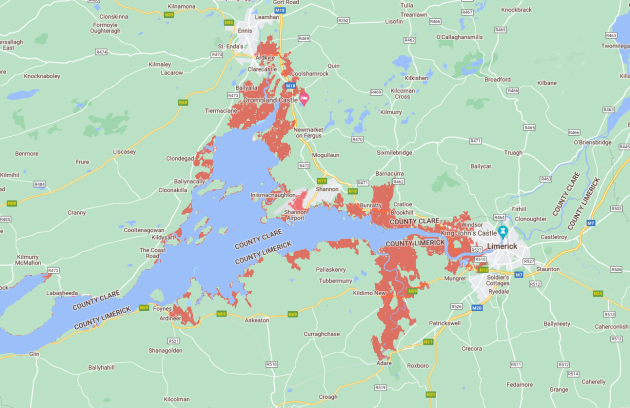
A map of the Shannon Estuary shows dramatic geographic changes to Limerick and Ennis, with massive amounts of their suburbs daubed in red, as well as most of Shannon Airport.

What the maps show

The data depicted in these maps — while concerning — does not show what the headlines suggest. Instead, as was correctly described in the body of one of the articles, they show areas that are in elevations below a predicted annual flood level for 2050.

Peter Girard, Director of Communications with Climate Central told The Journal by email that this referred to: 

[...] the water level expected to be reached, on average, at least once per year — generally during a coastal storm. The high tide line would be lower than that level, of course.

However, even interpreting the map like this has serious limitations, as Girard explained: 

Outside the US these maps do not take into account coastal flood defences or land friction.
So shaded areas represent land whose elevation is found to be lower than the selected water level, but could be protected by man-made defences or by their distance from the sea.

Climate Central’s map tool website itself warns that, due to errors, “ these maps should be regarded as screening tools to identify places that may require deeper investigation of risk.” 

While the maps featured in the Mirror article this week do not show that large areas of major Irish cities will be underwater by 2050, maps depicting which areas of land are projected to be underwater — which is to say, below the high tide mark — are available online, including ones provided by Climate Central.

While projections vary (and must rely on assumptions about how humanity is likely to act in the meantime among other factors), intermediate estimates often cluster around a 0.3 metre global sea level rise between the years 2000 and 2050. 

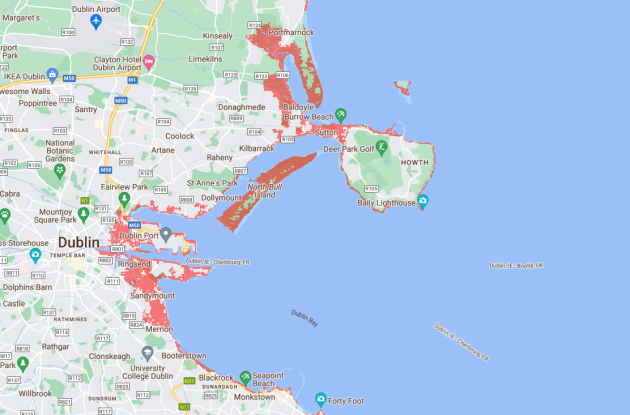
Under the Climate Central map of projected sea level rises, while significant areas around, for example, Portmarnock and parts of Bull Island in Dublin are still shaded red, the impact is clearly less dramatic than in the other set of maps.

Dublin below tideline by 2050 Via Climate Central

Alarmingly though, significant areas of land around Ennis and Limerick are still projected to be under high tide by 2050, unless held back by by flood defences, which were also not factored into these tideline maps.

Shannon below tideline by 2050 Via Climate Central

The Office of Public Works, which leads the implementation of the National Flood Policy, told The Journal that more accurate maps showing the predicted range of floods under sea level rise scenarios can be accessed at floodinfo.ie .

A 2020 survey of Irish coastal locations suggested that climate change would put more than 60,000 homes at risk of flooding by 2050, with Dublin, Louth and Clare expected to be the most affected counties.

The Journal’s FactCheck is a signatory to the International Fact-Checking Network’s Code of Principles. You can read it here. For information on how FactCheck works, what the verdicts mean, and how you can take part, check out our Reader’s Guide here. You can read about the team of editors and reporters who work on the factchecks here.